the Creative Commons Attribution 4.0 License.
the Creative Commons Attribution 4.0 License.
Monitoring the crisis of a rock glacier with repeated UAV surveys
Sebastián Vivero
Christophe Lambiel
In this study, rapid topographic changes and high creeping rates caused by the destabilisation of an active rock glacier in a steep mountain flank were investigated in detail with five unmanned aerial vehicle (UAV) surveys between June 2016 and September 2017. State-of-the-art photogrammetric techniques were employed to derived high-density point clouds and high-resolution orthophoto mosaics from the studied landform. The accuracy of the co-registration of subsequent point clouds was carefully examined and adjusted based on comparing stable areas outside the rock glacier, which minimised 3-D alignment errors to a mean of 0.12 m. Elevation and volumetric changes in the destabilised rock glacier were quantified over the study period. Surface kinematics were estimated with a combination of image correlation algorithms and visual inspection of the orthophoto mosaics. Between June 2016 and September 2017, the destabilised part of the rock glacier advanced up to 60–75 m and mobilised a volume of around 27 000 m3 of material which was dumped over the lower talus slope. This study has demonstrated a robust and customisable monitoring approach that allows a detailed study of rock glacier geometric changes during a crisis phase.
- Article
(4861 KB) - Full-text XML
- BibTeX
- EndNote
Active rock glaciers are dynamic in their nature, and they represent one of the most visible expressions of creeping mountain permafrost (Barsch, 1996; Haeberli et al., 2006). Rock glaciers provide a flux of debris and ice through the landscape, from the upper feeding zone, through the rock glacier body, to the terminus (Kääb and Reichmuth, 2005). The rate of mass transfer can be variable through time and space and depends on multiple factors, such as differential sediment evacuation or accumulation rates, 3-D deformation through either compressive or extensive flow regimes and changes in the rheological behaviour due to permafrost thawing or warming of ice (Kääb et al., 2007). Rock glacier velocities have increased considerably over the last four decades in places such as the European Alps (Delaloye et al., 2010; Roer et al., 2008), Alaska (Daanen et al., 2012) and the Tien Shan mountain range (Sorg et al., 2015). Since the last decade, and due to the high density of systematic in situ measurements, several rock glaciers in the European Alps have been identified as destabilised and significant changes in their morphology have been observed (Bodin et al., 2017; Kummert et al., 2018; Lambiel et al., 2017; Roer et al., 2008). The destabilisation of active rock glaciers has been observed by substantial changes in their kinematics and geometry (Delaloye et al., 2013; Roer et al., 2008). Recent examples, like the Bérard rock glacier in the southern French Alps, display how rock glaciers can suddenly change their dynamics to trigger a collapse (Bodin et al., 2017). In this context, the current increase in air and ground temperatures are considered to be the primary factors of rock glacier acceleration and destabilisation (Deline et al., 2015; Kääb et al., 2007; Roer et al., 2008), and through feedback processes such as the infiltration of meltwater (Buchli et al., 2013; Ikeda et al., 2008). Nevertheless, the relationship between different feedback processes is complex (Müller et al., 2016), and other factors that may produce a destabilisation of these landforms are mainly unknown.
Remote-sensing tools that monitor the changes in high-mountain regions have significantly progressed over the past few years in several key areas, as evidenced by advances in lidar (Micheletti et al., 2016), InSAR (Barboux et al., 2014), aerial photogrammetry (Fischer et al., 2013), and the availability of ready-to-use data and specialized software via web portals. However, the surge in unmanned aerial vehicle (UAV) systems has revolutionised the military, commercial and academic sectors due to their comparably lower operational costs, increased temporal frequencies and highly customisable settings (Carbonneau and Dietrich, 2016; Klauser and Pedrozo, 2017; Nex and Remondino, 2014). Simultaneously, new developments in the domain of image processing and photogrammetric techniques, such as structure for motion (SfM), have proliferated over recent years (Smith et al., 2016; Westoby et al., 2012). SfM photogrammetry has been used in different domains, such as monitoring ground deformation in permafrost environments (Arenson et al., 2016), snow depth from UAV data (Nolan et al., 2015) and for studying glacial and periglacial processes (Piermattei et al., 2016), among other applications. Still, the use of UAV systems and SfM techniques for monitoring the creep of mountain permafrost are few (Dall'Asta et al., 2017; Hendrickx et al., 2019), and the deployment of their full potential remains undeveloped.
Traditional approaches that are used to study substantial topographic or geometric changes on rock glaciers are based on digital elevation models (DEMs), in which an initial reference surface is subtracted from a subsequently modified surface (Bollmann et al., 2015; Kummert and Delaloye, 2018). This technique is also known as DEM differencing or DEM of difference (DoD; see Micheletti et al., 2015b). However, this kind of analysis should be limited to uniform or relatively flat terrain (Fischer et al., 2011) and where surface roughness can be neglected due to coarse-ground resolution and the inherent smoothing effect of the interpolation methods (Passalacqua et al., 2015). Thickness changes over steep slopes are better represented when the normal orientation of the reference surface is taking into account (Lague et al., 2013). Several methods have been used in this context, such as the Euclidean distance or the density-based spatial clustering of application with noise (DBSCAN) approaches (Fischer et al., 2011; Micheletti et al., 2016). In this context, it should be stressed that the thickness changes over complex terrain have to be studied directly alongside the analysis of point clouds instead of 2.5-D gridded data (i.e. DEM), as the former provides a more realistic 3-D depiction of surface areas compared with the planimetric representation of the latter (Watson et al., 2017).
The goal of this study is to develop a reliable and accurate monitoring approach based on UAV surveys and SfM techniques for measuring 3-D changes in an alpine rock glacier during a crisis phase. Our two primary objectives are (1) to investigate the reliability of the geometrical changes over a steep slope derived from repeated UAV surveys and thus evaluate the minimum level of detection (LOD) for each inter-survey comparison and (2) to quantify in very high detail the rock glacier surface changes over the study period.
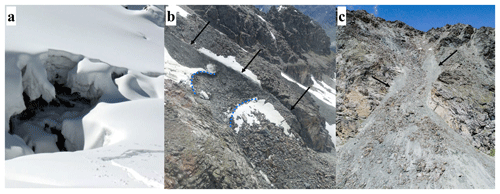
Despite comprehensive inventory and mapping efforts in the western Swiss Alps (Barboux et al., 2014; Lambiel et al., 2016), it can occur that some active rock glaciers were missed due to their small size or lack of well-defined boundaries. This is the case of La Roussette rock glacier (0.02 km2), which was recently identified in the upper Arolla valley (Fontanesses catchment), Valais Alps (Fig. 1). Incidentally, this rock glacier was first observed during ski touring sessions in March 2015 and April 2016, when large crevasses in the snow cover and fresh rock fragments detached from the rock glacier snout and deposited in the upper talus slope were witnessed (Fig. 2a and b). These observations suggested very rapid movements and the occurrence of an ongoing rock glacier crisis. Indeed, velocities were so high at this period that the snow cover cracked up to the ground surface. The rock glacier occupies a very small and narrow cirque between 3040 and 3160 m a.s.l. with a south-westerly aspect (Fig. 1). The initial shape of the landform is visible on former orthoimages (Fig. 1). Before the crisis, the rock glacier front was located at the outlet of the cirque, above a talus slope. It is henceforth a few tens of metres lower down (Fig. 2c). The surface matrix ranges from small angular rocks (20 cm) to boulders (up to 5 m) from an orthogneiss lithology (Arolla series). Based on earlier geophysical surveys and near-ground surface temperature measurements in the Fontanesses catchment, Gardaz (1997) suggested that the lower limit of discontinuous permafrost in the area reaches about 2700–2900 m a.s.l. for the commonly south-facing slopes. Further investigations in the same area made by Lambiel and Pieracci (2008) indicated that permafrost is likely present in the lower part of the adjacent talus slope at 2900 m a.s.l. Additionally, recent simulations of the permafrost distribution in the area showed that permafrost conditions are highly probable in the rock glacier area (Deluigi et al., 2017).
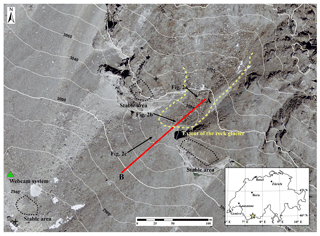
Figure 1Topographical context and location of La Roussette rock glacier before the crisis (21 August 2013) within the western Swiss Alps (inset, yellow star). The directions of photographs taken are shown in Fig. 2a–c. Red line (A–B) represents the elevation profile in Fig. 3. The background is an orthophoto from August 2013, reproduced by permission of swisstopo (BA18120).
Given the dynamic and hazardous terrain of the study area, the ventures to carry out in situ observations on this steep rock glacier remained highly limited. To overcome this, we developed a monitoring approach based on close-range remote-sensing techniques, which allowed us to study the crisis of this rock glacier on very high spatial and temporal resolutions. We performed five UAV surveys between summer 2016 and autumn 2017 using a fixed-wing senseFly eBee RTK device (Table 1). In addition to the extensive UAV surveys, a webcam system was installed in July 2016 with the aim of capturing daily time-lapse images (Fig. 1). This webcam system allowed us to deploy our UAV missions and to observe the rapid changes at the front of the rock glacier during the whole study period on a timely basis. The time-lapse video made from the daily images can be found in Vivero (2018).
The UAV device is equipped with a real-time kinematic (RTK) capable Global Navigation Satellite System (GNSS) antenna and with a Sony WX 4.5 mm focal length (since 2016) or a S.O.D.A 10.5 mm focal length (since 2017) cameras (Table 1). The senseFly eMotion 3 software (https://www.sensefly.com/software/emotion/, last access: 25 September 2018) was used for UAV mission planning and for performing differential corrections from a virtual reference station (VRS). Flight missions were performed with a longitudinal overlap of 80 % and a lateral overlap of 70 %. This flight configuration gave an availability of five overlapping images for every point reconstructed throughout the image block (Hendrickx et al., 2019). The VRS allowed the reception of broadcasted differential corrections via RTCM 3.1 protocol from the Automated GNSS Network for Switzerland (AGNES), using stable and permanent GNSS stations. We used the SwissALTI3D model as a base DEM in eMotion 3, which in our study area has a pixel resolution of 2 m and a vertical accuracy of ±1–3 m (Swisstopo, 2018), to design our UAV flights at a constant high above the ground in such steep mountainous terrain. In order to be consistent with other studies, horizontal measurements were referred to the Revised Swiss Reference System (CH1903 + LV95), and elevation data were recorded with respect to the Swiss geoid model version 2004 (CHGeo2004).
3.1 SfM-MVS processing
The structure from motion multi-view stereo (SfM-MVS) workflow implemented in PIX4Dmapper Pro version 4.1 software (https://pix4d.com/pix4dmapper-pro/, last access: 25 September 2018) was performed on each UAV survey dataset. Primarily, this workflow operates different algorithms to identify matching features in the image datasets and calculates camera orientation (Ω, Φ, K) and position (X, Y, Z) values from the different positions of multiple matched targets. Given the high accuracy of the camera coordinates obtained by the eBee RTK (less than 0.04 m), the calculation of the initial camera orientation (i.e. external orientation) parameters is significantly constrained by the RTK solution. To further constrain the orientation of the five UAV-derived models, three multi-temporal tie points extracted from the most recent model (25 September 2017) were added to the previous models (Soruco et al., 2009). This step relied on obvious points located on stable areas outside the rock glacier. In addition to the camera orientation adjustment, the software also performs a self-calibration of the internal camera parameters (i.e. interior orientation) such as focal length, principal point, and radial (R1–R3) and tangential (T1 and T2) distortion coefficients. After a coarse 3-D point cloud is created, MVS methods are applied to reconstruct a denser 3-D point cloud (Carrivick et al., 2016; Smith et al., 2016). These steps rely on the degree of image contrast and texture presented on the datasets, in which the rock glacier and the nearby terrain provide both good image contrast and texture on the scale of the ground sampling distance (GSD, ∼0.07 m) obtained for each UAV survey.
3.2 Point cloud operations
Processing of the point cloud data was done using Cloud Compare version 2.9 software (Girardeau-Montaut, 2018). This step included filtering erroneous points using a statistical outlier removal tool. Individual point clouds were segmented in stable areas outside the rock glacier (Fig. 1) and a bundle adjustment including an iterative closest point (ICP) alignment algorithm (Zhang, 1994) was performed to accurately register each point cloud to the master point cloud (25 September 2017). The ICP runs achieved optimal adjustments when the RMS difference between two iterations was lower than 10−8 m. Transformation matrices calculated from point cloud segments were applied to each full point cloud. These matrices include translation, rotation, and scale parameters. However, we found a constant scale factor of 1.0 for all the point clouds compared, which indicated that there were no scale differences between each point cloud pair. Therefore, the 3-D co-registration of point clouds was only executed with translation and rotation parameters.
We used the change-detection M3C2 algorithm (Lague et al., 2013), taking full advantage of the point cloud analysis instead of the traditional DoD procedure. M3C2 performs cloud-to-cloud distance calculations from selected points in the reference cloud. From these core points, the local surface normal is calculated, and the distance from the reference to the analysed point cloud is computed. These distances are not vertical (i.e. as in DEM differencing), as they account for the local surface roughness and locally variable slope, thus providing a more realistic thickness or surface change (Clapuyt et al., 2017; Lague et al., 2013). Additionally to the distance calculation, M3C2 provides spatially variable confidence intervals that help to assess the areas in which changes are statistically significant (i.e. 95 % confidence) or not.
3.3 Feature tracking
Surface displacements of the rock glacier were calculated between August 2016 and September 2017 for three pairs of orthophoto mosaics at ∼0.07 m pixel size. A modified version of the feature-tracking algorithm IMCORR (Fahnestock et al., 2016; Scambos et al., 1992), which was initially developed to measure changes from optical satellite imagery, was implemented in SAGA software to calculate rock glacier displacement vectors as a function of superficial changes for each pair of orthophoto mosaics. The normalised cross-covariance correlation employed by this method can locally adjust the intensity values (i.e. digital numbers) between two images, therefore compensating for the differences in illumination between two UAV surveys (Scambos et al., 1992). This is extremely helpful for cases in which UAV surveys are performed at different times and under diverse weather conditions (i.e. cloudy or clear sky). To account for the diverse displacement values, which in our case ranged from 0.1 to 15 m, different IMCORR search and reference image chip sizes were tested. After several iterations of the IMCORR algorithm, a more coherent set of vector fields (i.e. magnitude and orientation) were achieved with a search chip size of 256 (128) and a reference chip size of 64 (32) pixels, for high (low) displacement values.
False feature tracking may occur in some situations in which deep shadows are caused by different illumination conditions (i.e. solar azimuth and zenith angles). As the geometry of these shadows changed through the repeated UAV surveys, an apparent alteration of the shadow position can be tracked as a surface displacement. To avoid this problem, we identified the regions with deep shadows values and removed their values from IMCORR analyses. Additionally, results from feature tracking were cleaned and filtered to eliminate false measurements. Cleaning was carried out in all matches with x and y IMCORR error estimates larger than 1 pixel (0.07 m). Filtering was performed by using the Geographic Information System (GIS) ArcGIS (ESRI) with directional criteria (Redpath et al., 2013). Taking into account the slope gradient and the main orientation on the rock glacier, computed vectors with a direction less than 100∘ and greater than 290∘ were removed from our results.
4.1 Accuracy of point clouds and orthophotos
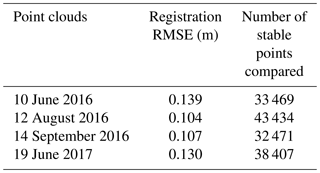
Given the hazardous and dynamic terrain of the study area, the potential to adequately assess the point cloud datasets remains challenging. In general, 3-D point clouds derived from SfM can display errors that are typically associated with camera orientation and self-calibration procedures. Additionally, image quality, stereo-matching parameters, surface texture and photographic scale can introduce further errors during MVS processing (Harwin et al., 2015). To assess the accuracy of the point clouds and orthophotos created by PIX4Dmapper, we selected three stable areas outside the rock glacier (Fig. 1) and computed their co-registration errors (Micheletti et al., 2016). This procedure provided a quality assessment of our point clouds as they were adjusted to the most recent dataset (25 September 2017), employing an average of 36 945 3-D points distributed over three regions. We obtained a mean 3-D alignment error of 0.12 m, with maximum and minimum errors of 0.139 and 0.104 m, respectively (Table 2). These values were used to calculate a spatially variable LOD at 95 % using the methods stipulated by Lague et al. (2013) and included in the M3C2 algorithm. Surface changes which were not statistically significant at the 95 % confidence level were removed from our analysis.
Table 2Relative values based on the co-registration error of each point cloud to the 25 September 2017 dataset and their number of stable points compared using the ICP algorithm.
IMCORR values over stable features (off rock glacier) were employed for quality assessment of the image co-registration (residuals). Areas with suspected surface changes were excluded from our quality analysis. The mean displacement in unchanging areas outside the rock glacier is 0.05 m, with a standard deviation of 0.03 m. These values revealed a good co-registration between the different orthophoto mosaics (i.e. subpixel residuals). In the light of the co-registration values and following Kääb and Vollmer (2000), we estimated the accuracy of the method to be of the order of 1 pixel (7 cm).
4.2 Thickness and volumetric changes
The downslope movement of the disconnected part of the rock glacier (below the crevasse, Fig. 2b) advanced 35 m during the first period (June to August 2016), and eventually, this destabilised part was transported and reworked to the upper talus slope (Fig. 3). Between August and September 2016, negative elevation changes started to lead to almost non-significant changes in summer 2017 (June to September). Multi-temporal thickness changes for four different periods are presented in Fig. 4. Maximum and minimum values ranging from −13 up to 8 m emphasise the extreme values during the study period. There was a major loss of material below the former crevasse (June 2016) and accumulation of material at the upper part of the talus slope (Figs. 3 and 4). The spatial pattern of mass gains and losses on this rock glacier mostly indicates a propagation of material from the upper zones towards the upper convex talus slope (Fig. 4). Between June 2016 and September 2017, the destabilised part mobilised around 27 000 m3 of material with a net volume change of −5721 m3. For the latter, an unknown volume percentage either went further down the talus slope (outside the analysed area in Fig. 4) or was lost due to ice melt.
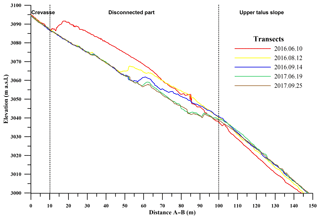
Figure 3Elevation transects through the disconnected central part of the rock glacier (see Fig. 1 for location). Elevation transects are considered from the upper part of the crevasse (Fig. 2b) in June 2016 (A) to the upper part of the talus slope (B).
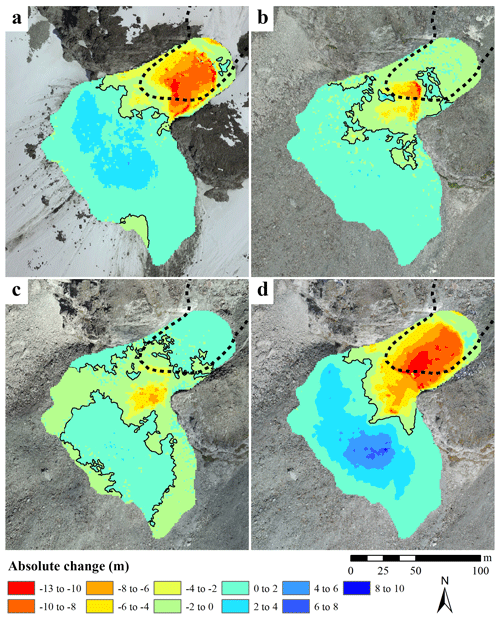
Figure 4Thickness changes featured in the destabilised part of the rock glacier and the upper talus slope. Changes between (a) 10 June–12 August 2016, (b) 12 August–14 September 2016, (c) 14 September 2016–19 June 2017 and (d) 10 June 2016–25 September 2017. Black lines represent the boundary between positive and negative absolute changes and dashed lines indicate the extent of the rock glacier in 2013. Background orthophoto mosaics are derived from (a) 10 June 2016, (b) 12 August 2016, (c) 14 September 2016 and (d) 25 September 2017 UAV surveys.
4.3 Surface movement
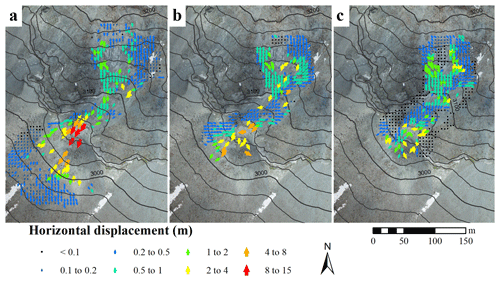
As described in Sect. 3.3, the IMCORR feature-tracking algorithm was used to compute ground displacements assuming a rigid translation from successive orthophoto mosaics. However, large chaotic displacements of individual boulders and drastic topographic changes between June and August 2016 hampered the detection of reliable displacement vectors for most of the rock glacier. As indicated in Sect. 4.2, we estimated maximum displacement values up to 35 m between June and August 2016, based on the observation of individual rocks and the elevation profile in Fig. 3. Automatically detected ground displacements between survey dates starting from August 2016 are shown in Fig. 5. Large displacements can be observed during the first period (August to September 2016), reaching up to 15 m in a month at the lower section of the rock glacier (Fig. 5a). Between September 2016 and June 2017, maximum displacement values decreased to 5 m. In the last period (summer 2017, Fig. 5c), displacement values of less than 0.5 m suggest a sharp deceleration of the rock glacier.
5.1 Limitations and outlooks of the monitoring approach
The main limitation of our approach is the feature tracking of rotating elements and very large displacements (i.e. more than 17 m), which leads to a lack of data in the lower area of the rock glacier (see Fig. 5a). Feature tracking algorithms such as IMCORR can only compute translational movements. Likewise, the pixel size of the orthophoto mosaics yields constraints on the maximum displacement of a tracking feature that can be computed. Whereas most of the translation movements on the upper and central parts are computed, rotational movements (i.e. due to the falling of boulders and drastic changes in the topography) and very large displacements on the lower part of the rock glacier are not automatically computed. The movement of tilting boulders can, however, be captured through the visual inspection of time-lapse image sequences (see Kummert et al., 2018) or more quantitatively by the analysis of monoscopic image sequences (James et al., 2016). In our case, the inclusion of the webcam system has not been performed in a quantitative manner, but further developments should go forward to fully integrating the daily surface displacements that can be derived from terrestrial images with repeated UAV-derived displacements (i.e. our current results).
High-density point clouds, high-resolution DEMs and orthophoto mosaics obtained from lidar or SfM photogrammetry via terrestrial or aerial platforms have already been employed to study rock glacier geomorphic changes. For illustration, Kummert and Delaloye (2018) employed lidar-derived multi-temporal DEMs to study the terminus of three active rock glaciers located in the western Swiss Alps and their associated torrential channels, whereas Kenner et al. (2018) provided a detailed description of surface movements using time-lapse photography on Ritigraben rock glacier. Likewise, Bodin et al. (2018) exploited a combination of terrestrial and aerial lidar measurements and ground-based SfM surveys to decipher the multi-annual kinematics from the Laurichard rock glacier in the French Alps. However, our study is the first one which manages to describe both thickness changes and surface movements by using high-density point clouds and high-resolution orthophoto mosaics derived from repeated UAV surveys. We also demonstrated the advantageous combination of close-range sensing techniques (i.e. UAV and webcam systems) to monitor the short-term dynamics of a landform during a crisis in high temporal and spatial resolutions.
5.2 Probable causes of the crisis
In the case of the so-called paraperiglacial crisis (Scapozza, 2016), the sudden change on rock glacier dynamics, which leads towards a possible rock glacier destabilisation or collapse, is one of the most spectacular outcomes of climate change in mountain areas. In the European Alps, the lower limit of mountain permafrost is already shifting upwards due to the increase in air temperature during spring/summer and extreme heatwaves (Harris et al., 2003; Pogliotti et al., 2015). However, even if the changes in ice properties due to permafrost warming and degradation may play a major role on rock glacier dynamics (Müller et al., 2016), the factors that can initiate rock glacier destabilisation are largely unknown (Bodin et al., 2017; Scotti et al., 2017). In this context, the following potential causes of the rock glacier destabilisation can be postulated:
-
The very warm permafrost conditions detected since 2008 over the Swiss Alps have been linked to an acceleration trend for a large sample of rock glaciers (PERMOS, 2016). La Roussette rock glacier probably experienced a similar acceleration and, in combination with the steep slope downside the landform, favoured the rupture in combination with (2) and by means of an increase in the movement at the shear horizon at the rock glacier terminus.
-
The topographical context of this landform located on a steep slope and the presence of even steeper slope downside (i.e. the upper talus slope) let the frontal part be “dragged” from its more or less stable position to the steeper lower convex topography.
-
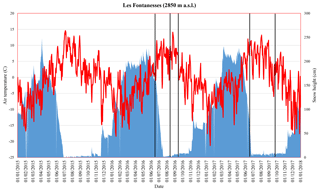
The summer 2015 heatwave in western Europe has had significant effects on mountain permafrost (Ravanel et al., 2017), which may have favoured the initial conditions for the rock glacier destabilisation process. Also, the meteorological conditions during summer 2016 (Fig. 6, Les Fontanesses area) indicate a strong melting period during the first observations, which coincides with the large topographical changes detected (Figs. 3 and 4a). These conditions may have induced a liquid water lubrication effect on the shear horizon just below the crevasses seen in Fig. 2a (Wirz et al., 2016) and thus caused the detachment of the lower section of the rock glacier.
The previously unknown and relatively small La Roussette rock glacier experienced an unexpected crisis that began at least in winter 2015, where the initial signs of destabilisation were observed. Between June 2016 and September 2017, the destabilised section mobilised around 27 000 m3 of material and displayed very high surface displacements up 60–75 m. However, this kind of rock glacier behaviour has rarely been documented on a seasonal timescale. Although the direct consequences of this destabilisation are not treating high-mountain infrastructure (i.e. ski lifts, mountain huts and roads), witnessing such strong morphological changes in a very short period shows how this particular case of sediment transfer can quickly modify high-mountain topography.
UAV systems are beneficial for monitoring inaccessible and remote areas, as they can provide high frequencies of observation in comparison with traditional monitoring techniques (i.e. ground surveys). Also, there is the practicality of confectioning or customising surveys to be adapted to the observable phenomena with few limitations, something that is almost impossible with traditional aerial surveys. This quantity and quality of the acquired data can reach or even exceed the data specifications for conventional aerial surveys. Furthermore, cloud-to-cloud comparisons provide a robust and straightforward option to calculate surface-normal thickness changes in steep mountain terrain between two or more UAV-derived cloud points. Given the current technological developments in the field of UAV devices, it is expected that the evolution of UAV capabilities will provide better and cheaper tools that can be further integrated into researching geomorphic processes in areas where traditional approaches are not feasible.
This work documents the use of close-range remote-sensing techniques to monitor the ongoing crisis of a rock glacier in a steep mountain flank. Further work should be focussed on the quantification of the previous geomorphological changes on this landform by the employment of archival aerial and terrestrial photogrammetric datasets available in the region (e.g. Micheletti et al., 2015a). The homogenization of the current UAV-derived datasets together with the reanalysis of historical photogrammetric sources will help to shed light on the long-term evolution of rock glacier dynamics under the current climate forcing.
Additional data for this study can be provided by the corresponding author upon request. The time-lapse video is available at https://doi.org/10.5446/38693 (Vivero, 2018).
CL instigated the initial studies for the rock glacier. SV and CL performed the collection of data in the field. SV performed data processing and analyses, wrote the initial version of the paper and designed all the figures under the supervision of CL.
The authors declare that they have no conflict of interest.
We would like to thank the two anonymous reviewers and the editor for their
constructive comments and suggestions. Also, acknowledgements go to
Sébastien Rüttimann, Régis Meyrat and Adeline Frossard for their
help during UAV surveys.
Edited by: Isabelle Gärtner-Roer
Reviewed by: two anonymous referees
Arenson, L. U., Kääb, A., and O'Sullivan, A.: Detection and Analysis of Ground Deformation in Permafrost Environments, Permafrost Periglac. Process., 27, 339–351, https://doi.org/10.1002/ppp.1932, 2016.
Barboux, C., Delaloye, R., and Lambiel, C.: Inventorying slope movements in an Alpine environment using DInSAR, Earth Surf. Proc. Land., 39, 2087–2099, https://doi.org/10.1002/esp.3603, 2014.
Barsch, D.: Rockglaciers: indicators for the present and former geoecology in high mountain environments, Springer-Verlag, Berlin, 1996.
Bodin, X., Krysiecki, J. M., Schoeneich, P., Le Roux, O., Lorier, L., Echelard, T., Peyron, M., and Walpersdorf, A.: The 2006 Collapse of the Bérard Rock Glacier (Southern French Alps), Permafrost Periglac. Process., 28, 209–223, https://doi.org/10.1002/ppp.1887, 2017.
Bodin, X., Thibert, E., Sanchez, O., Rabatel, A., and Jaillet, S.: Multi-Annual Kinematics of an Active Rock Glacier Quantified from Very High-Resolution DEMs: An Application-Case in the French Alps, Remote Sens., 10, 1–14, https://doi.org/10.3390/rs10040547, 2018.
Bollmann, E., Girstmair, A., Mitterer, S., Krainer, K., Sailer, R., and Stötter, J.: A Rock Glacier Activity Index Based on Rock Glacier Thickness Changes and Displacement Rates Derived From Airborne Laser Scanning, Permafrost Periglac. Process., 26, 347–359, https://doi.org/10.1002/ppp.1852, 2015.
Buchli, T., Merz, K., Zhou, X., Kinzelbach, W., and Springman, S. M.: Characterization and Monitoring of the Furggwanghorn Rock Glacier, Turtmann Valley, Switzerland: Results from 2010 to 2012, Vadose Zone J., 12, 1–15, https://doi.org/10.2136/vzj2012.0067, 2013.
Carbonneau, P. E. and Dietrich, J. T.: Cost-effective non-metric photogrammetry from consumer-grade sUAS: implications for direct georeferencing of structure from motion photogrammetry, Earth Surf. Proc. Land., 42, 473–486, https://doi.org/10.1002/esp.4012, 2016.
Carrivick, J. L., Smith, M. W., and Quincey, D. J.: Structure from Motion in the Geosciences, John Wiley & Sons, Ltd, Chichester, UK, 2016.
Clapuyt, F., Vanacker, V., Schlunegger, F., and Van Oost, K.: Unravelling earth flow dynamics with 3-D time series derived from UAV-SfM models, Earth Surf. Dynam., 5, 791–806, https://doi.org/10.5194/esurf-5-791-2017, 2017.
Daanen, R. P., Grosse, G., Darrow, M. M., Hamilton, T. D., and Jones, B. M.: Rapid movement of frozen debris-lobes: Implications for permafrost degradation and slope instability in the south-central Brooks Range, Alaska, Nat. Hazards Earth Syst. Sci., 12, 1521–1537, https://doi.org/10.5194/nhess-12-1521-2012, 2012.
Dall'Asta, E., Forlani, G., Roncella, R., Santise, M., Diotri, F., and Morra di Cella, U.: Unmanned Aerial Systems and DSM matching for rock glacier monitoring, ISPRS J. Photogramm. Remote Sens., 127, 102–114, https://doi.org/10.1016/j.isprsjprs.2016.10.003, 2017.
Delaloye, R., Lambiel, C., and Gärtner-Roer, I.: Overview of rock glacier kinematics research in the Swiss Alps: seasonal rhythm, interannual variations and trends over several decades, Geogr. Helvet., 65, 135–145, https://doi.org/10.5194/gh-65-135-2010, 2010.
Delaloye, R., Morard, S., Barboux, C., Abbet, D., Gruber, V., Riedo, M., and Gachet, S.: Rapidly moving rock glaciers in Mattertal, Jahrestagung der Schweizerischen Geomorphol. Gesellschaft, in: Mattertal – ein Tal in Bewegung, Publikation zur Jahrestagung der Schweizerischen Geomorphologischen Gesellschaft, 29 June–1 July 2011, edited by: Graf, C., Eidg. Forschungsanstalt WSL, St. Niklaus, Birmensdorf, 113–124, 2013.
Deline, P., Gruber, S., Delaloye, R., Fischer, L., Geertsema, M., Giardino, M., Hasler, A., Kirkbride, M., Krautblatter, M., Magnin, F., McColl, S., Ravanel, L., and Schoeneich, P.: Ice Loss and Slope Stability in High-Mountain Regions, in: Snow- and Ice-Related Hazards, Risks and Disasters, chap. 17, edited by: Haeberli, W. and Whiteman, C., Elsevier, Amsterdam, 521–561, 2015.
Deluigi, N., Lambiel, C., and Kanevski, M.: Data-driven mapping of the potential mountain permafrost distribution, Sci. Total Environ., 590–591, 370–380, https://doi.org/10.1016/j.scitotenv.2017.02.041, 2017.
Fahnestock, M., Scambos, T. A., Moon, T., Gardner, A. S., Haran, T., and Klinger, M.: Rapid large-area mapping of ice flow using Landsat 8, Remote Sens. Environ., 185, 84–94, https://doi.org/10.1016/j.rse.2015.11.023, 2016.
Fischer, L., Eisenbeiss, H., Kääb, A., Huggel, C., and Haeberli, W.: Monitoring topographic changes in a periglacial high-mountain face using high-resolution DTMs, Monte Rosa East Face, Italian Alps, Permafrost Periglac. Process., 22, 140–152, https://doi.org/10.1002/ppp.717, 2011.
Fischer, L., Huggel, C., Kääb, A., and Haeberli, W.: Slope failures and erosion rates on a glacierized high-mountain face under climatic changes, Earth Surf. Proc. Land., 38, 836–846, https://doi.org/10.1002/esp.3355, 2013.
Gardaz, J.: Distribution of Mountain Permafrost, Fontanesses Basin, Valaisian Alps, Switzerland, Permafrost Periglac. Process., 8, 101–105, https://doi.org/10.1002/(SICI)1099-1530(199701)8:1<101::AID-PPP241>3.0.CO;2-X, 1997.
Girardeau-Montaut, D.: Cloud Compare v2.9, available at: http://www.danielgm.net/cc/, last access: 25 September 2018.
Haeberli, W., Hallet, B., Arenson, L. U., Elconin, R., Humlum, O., Kääb, A., Kaufmann, V., Ladanyi, B., Matsuoka, N., Springman, S. M., and Mühll, D. V.: Permafrost creep and rock glacier dynamics, Permafrost Periglac. Process., 17, 189–214, https://doi.org/10.1002/ppp.561, 2006.
Harris, C., Mühll, D. V., Isaksen, K., Haeberli, W., Sollid, J. L., King, L., Holmlund, P., Dramis, F., Guglielmin, M., and Palacios, D.: Warming permafrost in European mountains, Global Planet. Change, 39, 215–225, https://doi.org/10.1016/j.gloplacha.2003.04.001, 2003.
Harwin, S., Lucieer, A., and Osborn, J.: The impact of the calibration method on the accuracy of point clouds derived using unmanned aerial vehicle multi-view stereopsis, Remote Sens., 7, 11933–11953, https://doi.org/10.3390/rs70911933, 2015.
Hendrickx, H., Vivero, S., De Cock, L., De Wit, B., De Maeyer, P., Lambiel, C., Delaloye, R., Nyssen, J., and Frankl, A.: The reproducibility of SfM algorithms to produce detailed Digital Surface Models: the example of PhotoScan applied to a high-alpine rock glacier, Remote Sens. Lett., 10, 11–20, https://doi.org/10.1080/2150704X.2018.1519641, 2019.
Ikeda, A., Matsuoka, N., and Kääb, A.: Fast deformation of perennially frozen debris in a warm rock glacier in the Swiss Alps: An effect of liquid water, J. Geophys. Res.-Earth, 113, 1–12, https://doi.org/10.1029/2007JF000859, 2008.
James, M. R., How, P., and Wynn, P. M.: Pointcatcher software: Analysis of glacial time-lapse photography and integration with multitemporal digital elevation models, J. Glaciol., 62, 159–169, https://doi.org/10.1017/jog.2016.27, 2016.
Kääb, A. and Reichmuth, T.: Advance mechanisms of rock glaciers, Permafrost Periglac. Process., 16, 187–193, https://doi.org/10.1002/ppp.507, 2005.
Kääb, A. and Vollmer, M.: Surface geometry, thickness changes and flow fields on creeping mountain permafrost: Automatic extraction by digital image analysis, Permafrost Periglac. Process., 11, 315–326, https://doi.org/10.1002/1099-1530(200012)11:4<315::AID-PPP365>3.0.CO;2-J, 2000.
Kääb, A., Frauenfelder, R., and Roer, I.: On the response of rockglacier creep to surface temperature increase, Global Planet. Change, 56, 172–187, 2007.
Kenner, R., Phillips, M., Limpach, P., Beutel, J., and Hiller, M.: Monitoring mass movements using georeferenced time-lapse photography: Ritigraben rock glacier, western Swiss Alps, Cold Reg. Sci. Technol., 145, 127–134, https://doi.org/10.1016/j.coldregions.2017.10.018, 2018.
Klauser, F. and Pedrozo, S.: Introduction: Power and space in the drone age, Geogr. Helvet., 72, 409–410, https://doi.org/10.5194/gh-72-409-2017, 2017.
Kummert, M. and Delaloye, R.: Mapping and quantifying sediment transfer between the front of rapidly moving rock glaciers and torrential gullies, Geomorphology, 309, 60–76, https://doi.org/10.1016/j.geomorph.2018.02.021, 2018.
Kummert, M., Delaloye, R., and Braillard, L.: Erosion and sediment transfer processes at the front of rapidly moving rock glaciers: Systematic observations with automatic cameras in the western Swiss Alps, Permafrost Periglac. Process., 29, 21–33, https://doi.org/10.1002/ppp.1960, 2018.
Lague, D., Brodu, N., and Leroux, J.: Accurate 3D comparison of complex topography with terrestrial laser scanner: Application to the Rangitikei canyon (N-Z), ISPRS J. Photogramm. Remote Sens., 82, 10–26, https://doi.org/10.1016/j.isprsjprs.2013.04.009, 2013.
Lambiel, C. and Pieracci, K.: Permafrost distribution in talus slopes located within the alpine periglacial belt, Swiss Alps, Permafrost Periglac. Process., 19, 293–304, https://doi.org/10.1002/ppp.624, 2008.
Lambiel, C., Maillard, B., Kummert, M., and Reynard, E.: Geomorphology of the Hérens valley (Swiss Alps), J. Maps, 12, 160–172, https://doi.org/10.1080/17445647.2014.999135, 2016.
Lambiel, C., Rüttimann, S., Meyrat, R., and Vivero, S.: Capturing the crisis of an active rock glacier with UAV survey, in: EGU Gen. Assem., 23–28 April 2017, Vienna, Austria, 2017.
Micheletti, N., Lane, S. N., and Chandler, J. H.: Application of archival aerial photogrammetry to quantify climate forcing of alpine landscapes, Photogramm. Rec., 30, 143–165, https://doi.org/10.1111/phor.12099, 2015a.
Micheletti, N., Lambiel, C., and Lane, S. N.: Investigating decadal-scale geomorphic dynamics in an alpine mountain setting, J. Geophys. Res.-Earth, 120, 2155–2175, https://doi.org/10.1002/2015JF003656, 2015b.
Micheletti, N., Tonini, M., and Lane, S. N.: Geomorphological activity at a rock glacier front detected with a 3D density-based clustering algorithm, Geomorphology, 278, 287–297, https://doi.org/10.1016/j.geomorph.2016.11.016, 2016.
Müller, J., Vieli, A., and Gärtner-Roer, I.: Rock glaciers on the run – Understanding rock glacier landform evolution and recent changes from numerical flow modeling, The Cryosphere, 10, 2865–2886, https://doi.org/10.5194/tc-10-2865-2016, 2016.
Nex, F. and Remondino, F.: UAV for 3D mapping applications: A review, Appl. Geomat., 6, 1–15, https://doi.org/10.1007/s12518-013-0120-x, 2014.
Nolan, M., Larsen, C., and Sturm, M.: Mapping snow depth from manned aircraft on landscape scales at centimeter resolution using structure-from-motion photogrammetry, The Cryosphere, 9, 1445–1463, https://doi.org/10.5194/tc-9-1445-2015, 2015.
Passalacqua, P., Belmont, P., Staley, D. M., Simley, J. D., Arrowsmith, J. R., Bode, C. A., Crosby, C., DeLong, S. B., Glenn, N. F., Kelly, S. A., Lague, D., Sangireddy, H., Schaffrath, K., Tarboton, D. G., Wasklewicz, T., and Wheaton, J. M.: Analyzing high resolution topography for advancing the understanding of mass and energy transfer through landscapes: A review, Earth-Sci. Rev., 148, 174–193, https://doi.org/10.1016/j.earscirev.2015.05.012, 2015.
PERMOS: Permafrost in Switzerland 2010/2011 to 2013/2014, edited by: Noetzli, J., Luethi, R., and Staub, B., Glaciological Report Permafrost No. 12–15, Cryospheric Commission of the Swiss Academy of Sciences, Zurich, 85 pp., 2016.
Piermattei, L., Carturan, L., De Blasi, F., Tarolli, P., Dalla Fontana, G., Vettore, A., and Pfeifer, N.: Suitability of ground-based SfM-MVS for monitoring glacial and periglacial processes, Earth Surf. Dynam., 4, 425–443, https://doi.org/10.5194/esurf-4-425-2016, 2016.
Pogliotti, P., Guglielmin, M., Cremonese, E., Morra Di Cella, U., Filippa, G., Pellet, C., and Hauck, C.: Warming permafrost and active layer variability at Cime Bianche, Western European Alps, The Cryosphere, 9, 647–661, https://doi.org/10.5194/tc-9-647-2015, 2015.
Ravanel, L., Magnin, F., and Deline, P.: Impacts of the 2003 and 2015 summer heatwaves on permafrost-affected rock-walls in the Mont Blanc massif, Sci. Total Environ., 609, 132–143, https://doi.org/10.1016/j.scitotenv.2017.07.055, 2017.
Redpath, T. A. N., Sirguey, P., Fitzsimons, S. J., and Kääb, A.: Accuracy assessment for mapping glacier flow velocity and detecting flow dynamics from ASTER satellite imagery: Tasman Glacier, New Zealand, Remote Sens. Environ., 133, 90–101, https://doi.org/10.1016/j.rse.2013.02.008, 2013.
Roer, I., Haeberli, W., Avian, M., Kaufmann, V., Delaloye, R., Lambiel, C., and Kääb, A.: Observations and considerations on destabilizing active rock glaciers in the European Alps, in: Proceedings of the 9th International Conference on Permafrost, Fairbanks, 1505–1510, 2008.
Scambos, T. A., Dutkiewicz, M. J., Wilson, J. C., and Bindschadler, R. A.: Application of image cross-correlation to the measurement of glacier velocity using satellite image data, Remote Sens. Environ., 42, 177–186, https://doi.org/10.1016/0034-4257(92)90101-O, 1992.
Scapozza, C.: Evidence of paraglacial and paraperiglacial crisis in alpine sediment transfer since the last glaciation (Ticino, Switzerland), Quaternaire, 27, 139–155, https://doi.org/10.4000/quaternaire.7805, 2016.
Scotti, R., Crosta, G. B., and Villa, A.: Destabilisation of Creeping Permafrost: The Plator Rock Glacier Case Study (Central Italian Alps), Permafrost Periglac. Process., 28, 224–236, https://doi.org/10.1002/ppp.1917, 2017.
Smith, M. W., Carrivick, J. L., and Quincey, D. J.: Structure from motion photogrammetry in physical geography, Prog. Phys. Geogr., 40, 247–275, https://doi.org/10.1177/0309133315615805, 2016.
Sorg, A., Kääb, A., Roesch, A., Bigler, C., and Stoffel, M.: Contrasting responses of Central Asian rock glaciers to global warming, Sci. Rep., 5, 8228, https://doi.org/10.1038/srep08228, 2015.
Soruco, A., Vincent, C., Francou, B., Ribstein, P., Berger, T., Sicart, J.-E., Wagnon, P., Arnaud, Y., Favier, V., and Lejeune, Y.: Mass balance of Glaciar Zongo, Bolivia, between 1956 and 2006, using glaciological, hydrological and geodetic methods, Ann. Glaciol., 50, 1–8, https://doi.org/10.3189/172756409787769799, 2009.
Swisstopo: swissALTI3D – The high precision digital elevation model of Switzerland, available at:https://shop.swisstopo.admin.ch/en/products/height_models/alti3D (last access: 25 September 2017), 2018.
Vivero, S.: Monitoring the crisis of a rock glacier with repeated UAV surveys, https://doi.org/10.5446/38693, 2018.
Watson, C. S., Quincey, D. J., Smith, M. W., Carrivick, J. L., Rowan, A. V., and James, M. R.: Quantifying ice cliff evolution with multi-temporal point clouds on the debris-covered Khumbu Glacier, Nepal, J. Glaciol., 63, 823–837, https://doi.org/10.1017/jog.2017.47, 2017.
Westoby, M. J., Brasington, J., Glasser, N. F., Hambrey, M. J., and Reynolds, J. M.: “Structure-from-Motion” photogrammetry: A low-cost, effective tool for geoscience applications, Geomorphology, 179, 300–314, https://doi.org/10.1016/j.geomorph.2012.08.021, 2012.
Wirz, V., Gruber, S., Purves, R. S., Beutel, J., Gärtner-Roer, I., Gubler, S., and Vieli, A.: Short-term velocity variations at three rock glaciers and their relationship with meteorological conditions, Earth Surf. Dynam., 4, 103–123, https://doi.org/10.5194/esurf-4-103-2016, 2016.
Zhang, Z.: Iterative point matching for registration of free-form curves and surfaces, Int. J. Comput. Vis., 13, 119–152, https://doi.org/10.1007/BF01427149, 1994.
