the Creative Commons Attribution 4.0 License.
the Creative Commons Attribution 4.0 License.
 | 27 Oct 2025
Rockwall erosion rate inferred from in situ 10Be concentration of supraglacial clasts: a review
Léa Courtial-Manent
Jean-Louis Mugnier
Anta-Clarisse Sarr
Ludovic Ravanel
Julien Carcaillet
Riccardo Vassallo
Arthur Schwing
Supraglacial clasts originate from rockfalls onto glacier surfaces, accumulating in situ-produced 10Be during rockwall exposure and glacial transport. For small glaciers, the transport-related 10Be component is negligible, enabling millennial erosion rate estimates based on clast concentration measurements. Since 2009, 11 studies – to our knowledge – have analyzed 10Be concentrations in supraglacial clasts across 31 glaciers in Alaska, the Western Alps, and the Himalayas. These studies reveal high variability in 10Be concentration among glaciers. This variability is due to the heterogeneous 10Be content of large rockfalls. In this paper, recommendations are proposed to improve the reliability of the method. In particular, reliability can be increased by amalgamating numerous small clasts taken from large supraglacial areas and by carrying out several (at least five) geochemical analyses per glacier. Erosion rates range from 0.24 to 11 mm yr−1. Comparison with long-term exhumation and contemporary uplift rates reveals three situations: erosion rates that align with, exceed, or fall below uplift and exhumation rates. Low erosion rates suggest permafrost shielding, while high rates may reflect climate-driven thermal changes. These findings highlight the interplay between glacial processes, erosion, and climate dynamics.
- Article
(16747 KB) - Full-text XML
-
Supplement
(332 KB) - BibTeX
- EndNote


Earth's landscape, shaped by the interplay between tectonics and climate, is a dynamic interface over which many physical, biological, and geochemical cycles operate (Allen, 2008). Erosion encompasses the processes by which the Earth's surface is progressively worn down, either gradually through meteoritic forcing or abruptly during instantaneous events such as debris flows or landslides. In mountain ranges, characterized by numerous steep rockwalls, rockfalls constitute the dominant erosion mechanism (Burbank et al., 1996). However, it is still debated if the primary erosion driver is climate (Gabet et al., 2004) or tectonics (Burbank and Anderson, 2011).
In addition, determining the temporal distribution and magnitude of rockfall events affecting a rockwall remains a challenge (Dussauge et al., 2003). Rockfall inventories (Ravanel and Deline, 2011) do not encompass high-volume, low-frequency events, and therefore, erosion rate estimates from these inventories are biased (Courtial-Manent et al., 2025). Geochronology using terrestrial cosmogenic nuclides (TCNs), which enables the estimation of long-term erosion rates (von Blanckenburg, 2006), provides additional insight into rockfall studies (Puchol et al., 2014).
In glacial catchments, long-term (103–105 years) rockwall erosion rates have been quantified since 2009 using in situ-produced 10Be measurements of supraglacial debris. Indeed, glaciers transport and amalgamate rockfall debris from their upper supply zones to the supraglacial deposits of their tongues. Since 2009, 11 studies – to our knowledge – have employed this approach: Seong et al. (2009), Ward and Anderson (2011), Orr et al. (2019, 2021), Sarr et al. (2019), Matmon et al. (2020), Scherler and Egholm (2020), Wetterauer et al. (2022), Wetterauer and Scherler (2023), and Courtial-Manent et al. (2024b, 2025).
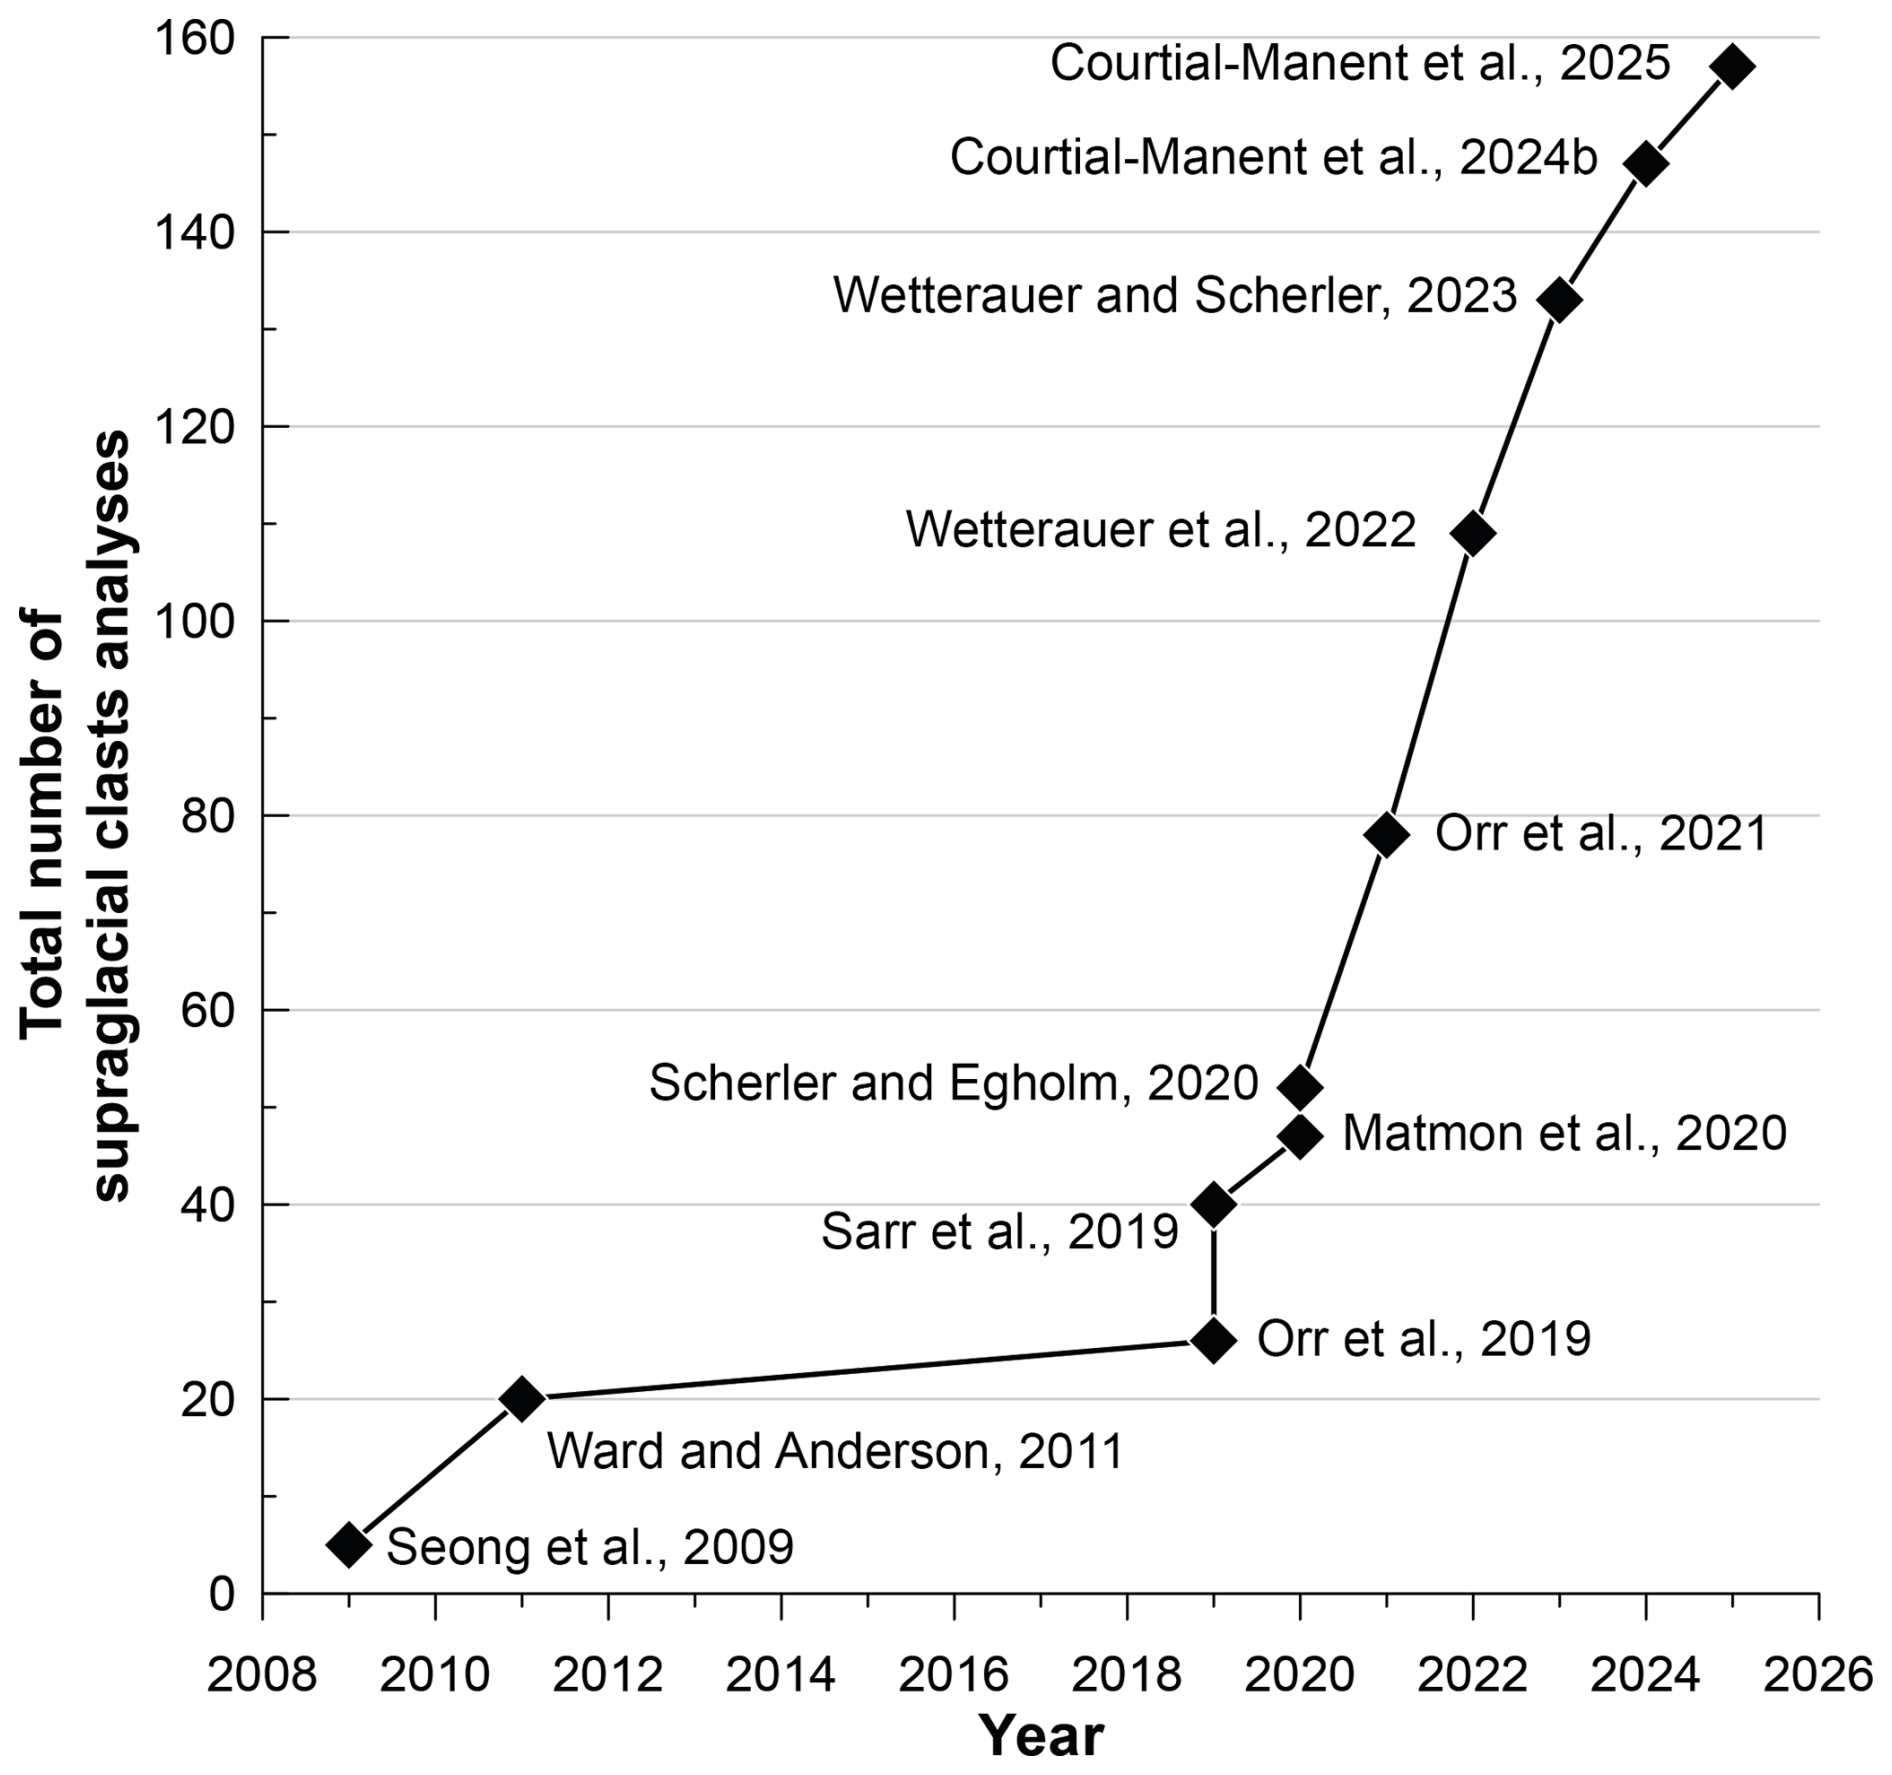
An overview of the influence of rockfall characteristics is provided by Ward and Anderson (2011), while that of glacial transport is provided by Scherler and Egholm (2020). The cumulative number of supraglacial debris analyses was 147 in 2024 (Fig. 1), and 10 new analyses, presented in this paper, bring the total to 157 (Table S1 in the Supplement). Although all these analyses provide erosion rate estimates for an increasing number of glacier catchments, their total number remains small: 10Be studies have covered 31 glacier catchments worldwide, while 375 river catchments have been studied in the Alps alone (Delunel et al., 2020). Differences in the application of the methodology make comparison between datasets difficult. Moreover, this set of 10Be supraglacial studies still debates the primary erosion driver that is either tectonics for Orr et al. (2021) or climate for Wetterauer and Scherler (2023) and Courtial-Manent et al. (2025).
In this paper, we review the fundamental principles used to infer rockwall erosion rates from in situ-produced 10Be concentrations of supraglacial clasts. We critically examine the relevant studies and propose recommendations to improve the method's reliability. We emphasize the need to collect samples from as many rockfalls as possible, over a wide area, and using small grain sizes, as well as the necessity of conducting numerous 10Be analyses for each glacier.
We provide a compilation of previously published 147 10Be measurements that we complemented with 10 new 10Be measurements from a low-altitude (Tsijiore Nouve) and high-altitude (Bossons) catchment. Those new data also include measurements aiming at analyzing the TCN signature of a rockfall of over a scale of 106 m3 years (derived from 10Be concentrations in supraglacial clasts) with vertical change rates at a scale of 106 years (exhumation rates from apatite fission track; AFT) and at a scale of 101 years (uplift rates from geodetic measurements). This multi-timescale comparison emphasizes that tectonics only plays a clear role if it is rapid, as seen in the Himalayas. Our geomorphologic analysis, which integrates the whole alpine 10Be dataset (86 measurements), does not show a robust correlation with the mean slope and a thermal parameter, such as the mean annual rock surface temperature (MARST) but outlines a negative correlation between erosion rate and the mean elevation of rockwalls.
2.1 Cosmogenic nuclide production
The use of TCNs as indicators of surface evolution is currently one of the most effective methods in quantitative geomorphology (Gosse and Phillips, 2001; Dunai, 2010; Schaefer et al., 2022). TCNs are produced by nuclear reactions between cosmic ray particles and the nuclei of elements in Earth's environment (Balco et al., 2008; Dunai, 2010). The cascade of nuclear reactions induced by cosmic rays, from interactions in the upper atmosphere to in situ-produced 10Be production within the top few meters of the Earth's surface, is complex. This cascade has been described in numerous studies (e.g., Dunai, 2010; von Blanckenburg and Willenbring, 2014) and is not detailed further in this article.
The most commonly used TCNs are beryllium (10Be), radiocarbon (14C), aluminum (26Al), chlorine (36Cl), and helium (3He). Each isotope has its intrinsic characteristics (production modality and rate, half-life, etc.) and rock target. Beryllium's main target mineral is quartz (SiO2), and 10Be is therefore suited for studying the geomorphology of quartz-rich rock areas. It is currently the unique TCN used, as far as is known, for studying supraglacial clasts.
10Be is a radioactive TCN, meaning its concentration decreases over time when the production rate is zero or lower than its rate of radioactive decay. However, 10Be has a long half-life (1.39±0.012 Ma; Chmeleff et al., 2010; Korschinek et al., 2010), so radioactive decay is generally negligible in studies where intense erosion rates remove 10Be accumulated over more than a few tens of thousands of years (Beel et al., 2016), particularly in supraglacial clasts studies.
The distribution of cosmic ray particles reaching the Earth's surface is anisotropic due to the effect of orientation on trajectory length through the atmosphere, with the highest particle flux occurring near vertical incidence (Dunai, 2010). Cosmogenic nuclide production rates vary with geographic location and over time, as changes in Earth's magnetic field intensity and the thickness of atmospheric layers traversed by cosmic rays influence them (von Blanckenburg and Willenbring, 2014). Estimating cosmogenic nuclide production rates at any point on Earth requires physical models incorporating a scaling scheme, atmospheric models, and a geomagnetic database. An international initiative is currently underway to establish a standardized methodology (Borchers et al., 2016; Marrero et al., 2016; Martin et al., 2017), but its development remains in progress, and the methodology is continually being refined.
Several particles (muons, slow, and fast neutrons) contribute to 10Be production (Braucher et al., 2003; Farber et al., 2008). Muons dominate production only at great depth (Braucher et al., 2003), while on the Earth's surface, neutron-induced production prevails (98 %). As a result, studies focusing on supraglacial clasts or any exposed rock surface typically consider only the neutron-induced component of 10Be production.
2.2 Surface erosion and cosmogenic nuclides
According to Heisinger et al. (1997) and Dunai (2010), the 10Be surface concentration is mainly determined by three variables: surface production rate, exposure time, and erosion rate.
A surface exposed to cosmic rays accumulates cosmogenic nuclides proportionally to the exposure time and the surface production rate. Topographic features that obstruct the flux of incoming cosmic rays are accounted for using topographic shielding estimates (Norton and Vanacker, 2009). Snow cover effects are generally neglected in rockwall studies, as snow must remain for at least 4 months per year at a thickness of 150 cm to reduce annual cosmogenic nuclide production by ∼10 % (Dunai, 2010), conditions that steep rockwalls typically prevent.
Conversely, erosion decreases TCN concentration at the surface by bringing material to the surface where cosmic rays have been partly or totally attenuated. Thus, the higher the erosion rate, the lower the 10Be concentration in samples. Under conditions of constant erosion over a long period, equilibrium is achieved between cosmogenic production by cosmic rays and losses due to radioactive decay and erosion. At this equilibrium, surface concentration tends toward a constant value independent of exposure time: equilibrium surface concentration (C0) is then proportional to the production rate at the surface (P0) and the attenuation at depth of the production (Λsp the attenuation length) and inversely proportional to the erosion rate ε and to the rock density (ρ) (Eq. 1 from von Blanckenburg, 2006):
This theoretical equation applies to local outcrops subject to continuous and constant erosion (Nichols et al., 2007), such as lateritic soils (Braucher et al., 1998), and requires a continuous erosion over a period sufficient to erode a thickness equal to the attenuation length, at which point nuclide concentrations reflect the steady-state erosion rate.
This constant and continuous erosion assumption has been adapted to catchment-wide erosion studies by applying the concept of “letting nature do the averaging” (Allen, 2008), meaning that the transported sediments through the landscape (Fig. 2) naturally integrate erosion signals from across diverse geomorphological settings. Then, average sediment concentration (Csed) at the catchment outlet is considered representative of the average catchment-wide erosion (εml) (Fig. 2a) over timescales required to erode a thickness equal to the attenuation length (∼60 cm, von Blanckenburg, 2006). The average erosion rate is calculated from the average 10Be rockwall production rate (Pmr) using Eq. (2) (Granger et al., 1996):
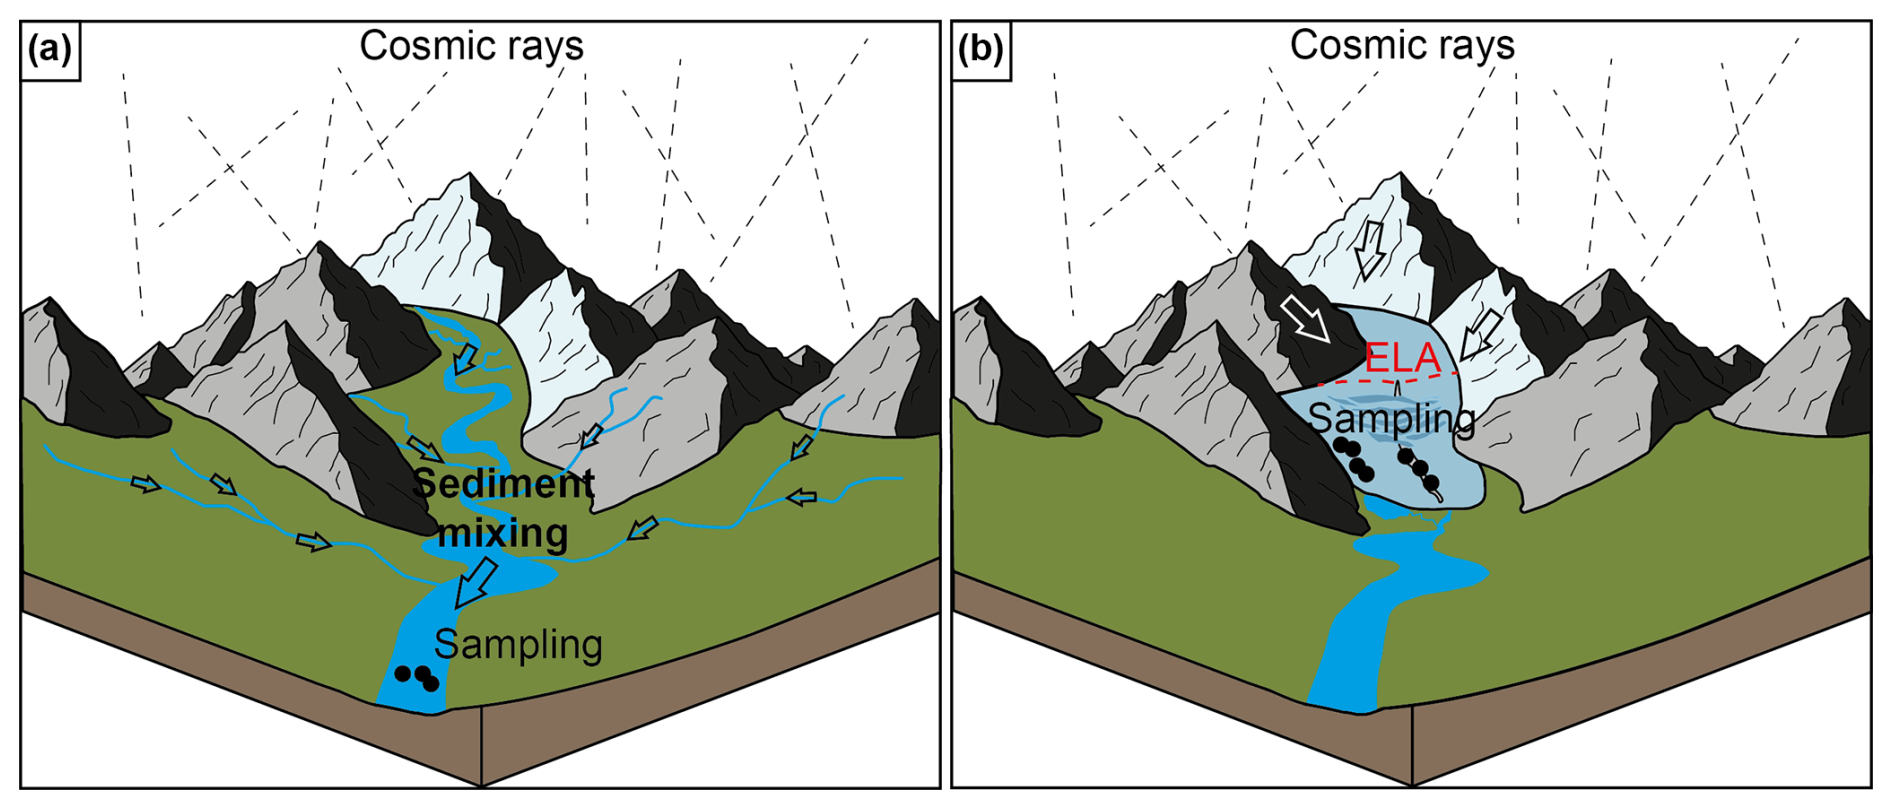
Figure 2Comparison of the sampling strategy between (a) an unglaciated sedimentary catchment and (b) a glaciated catchment.
2.3 Erosion rates and supraglacial clasts 10Be concentration
The adaptation of the “letting nature do the averaging” concept to englacial catchments (Fig. 2b) was pioneered by Seong et al. (2009) and Ward and Anderson (2011). In these studies, clasts were sampled from glacier surfaces, and their 10Be concentrations are assumed to reflect the mean upstream erosion rate (von Blanckenburg et al., 2004). However, the formation and transport processes for supraglacial clasts differ markedly from those occurring for river sediments.
In glacial catchments, transport involves a succession of distinct phases (Fig. 3): (I) rockwall erosion, which brings rock closer to the rockfall surface (this process is not linear on a site, as it may involve large pieces falling off, but an average erosion rate could be estimated for a large rockwall and over a long period); (II) rockfall; (III) englacial transport; and (IV) surface transport on the glacier. The duration of each phase varies significantly by context, with the erosion phase scaled with the time necessary to erode the attenuation length (Dunai, 2010), i.e., several hundred to several thousand years, while the englacial and glacier-surface transport phases range from a decade to several hundred years. In most cases, the 10Be concentration accumulates primarily during the exhumation stage, whereas supraglacial transport makes a minor contribution, and other stages either are too rapid or occur under conditions shielded from cosmic radiation.
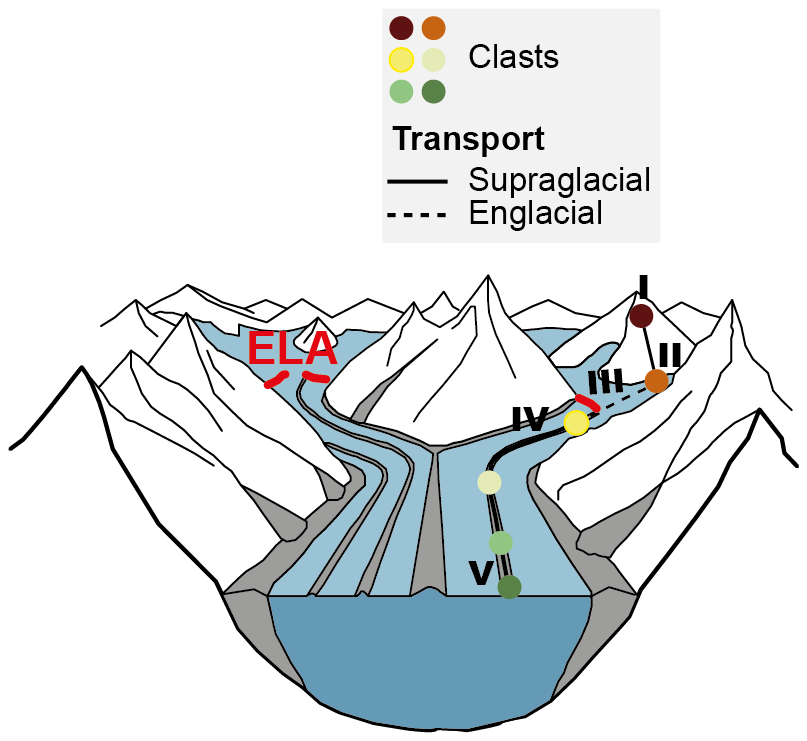
Figure 3The geomorphological system considered in this review. Schematic view of a valley glacier incorporating rockwall erosion products into medial and lateral moraines. Adapted from Ward and Anderson (2011) and Scherler and Egholm (2020). Roman numerals describe the different phases: (I) rockwall erosion, (II) rockfall, (III) englacial transport, (IV) surface transport on the glacier, and (V) sampling location.
Nonetheless, supraglacial 10Be concentrations within a single glacier catchment (Sarr et al., 2019) exhibit a large dispersion, illustrating the difference between fluvial and glacial transport processes. In contrast to fluvial systems, glacial transport involves more limited mixing, as clasts largely adhere to specific flow lines with minimal lateral interaction. In addition, while rivers facilitate relatively continuous mixing over time, glacial ablation accumulates rockfalls from discrete and often brief periods, in particular in small, fast-moving glaciers.
The objectives of previous supraglacial studies are varied, from developing glacial transport models to test how different source zone scenarios influence the final location of clasts (Scherler and Egholm, 2020) to analyzing the influence of sample distribution and grain size (Ward and Anderson, 2011). Some studies focus on assessing the temporal and spatial variation of erosion rates (Wetterauer et al., 2022; Wetterauer and Scherler, 2023; Courtial-Manent et al., 2025), while others aim to estimate erosion rates at the scale of a glacier catchment (Seong et al., 2009; Sarr et al., 2019; Orr et al., 2019, 2021; Matmon et al., 2020). These objectives influence sampling location, granulometric selection, sampling surface area, and transport analysis.
Scherler and Egholm (2020) used a forward description of the transport sequence through numerical modeling, whereas the other studies analyzed the transport sequence in reverse, tracing from the clast's final position back to its source; we adopt this last approach in our review.
3.1 Study locations
We included only studies that directly measured 10Be in supraglacial clasts to estimate erosion rates. Therefore, the study by Heimsath and McGlynn (2008), although often regarded as a precursor to the method, has not been considered here. Heimsath and McGlynn (2008) used the 10Be concentration to date supraglacial deposits and estimated erosion rates (Eq. 1) only for bedrock located on valley sides. The average erosion rate of upward rockwalls was estimated from the supraglacial sediment volume and glacier velocity, the latter assessed by measuring the thickness of the deposits. Seong et al. (2009) were therefore the first to derive rockface erosion rates from 10Be concentrations in supraglacial clasts
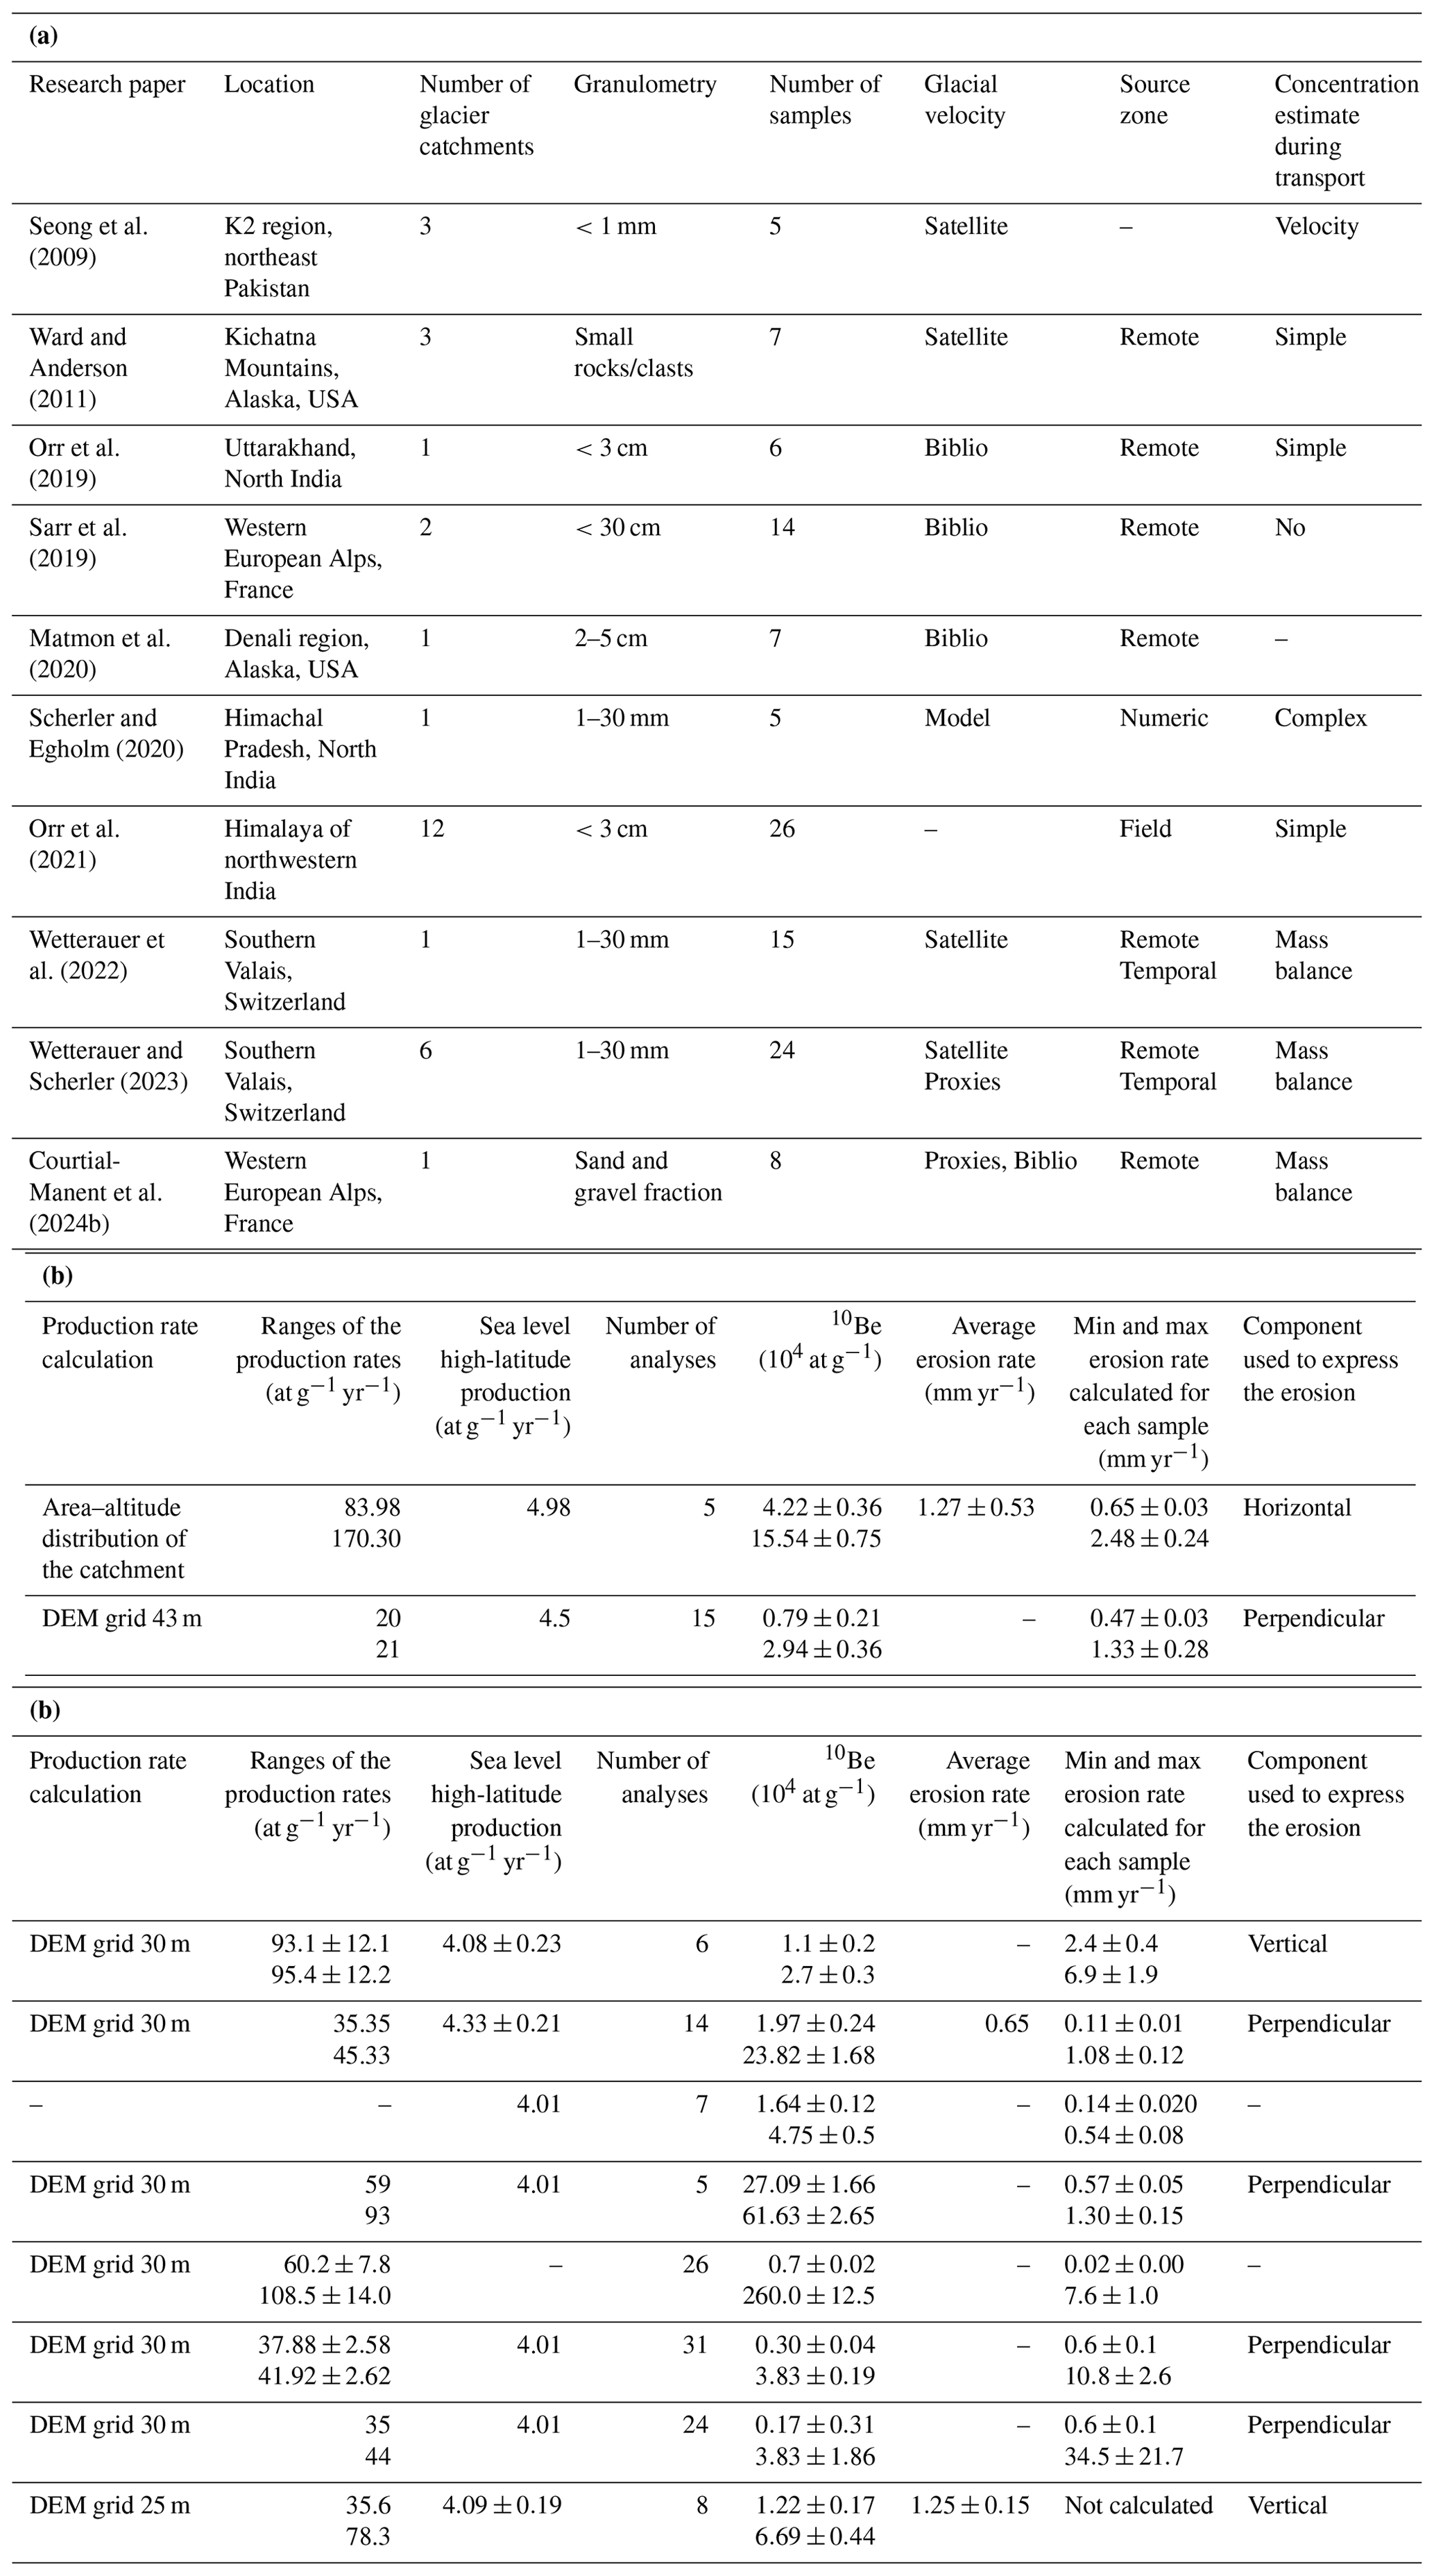
Studies by Ward and Anderson (2011), Orr et al. (2019, 2021), Sarr et al. (2019), Matmon et al. (2020), Scherler and Egholm (2020), Wetterauer et al. (2022), Wetterauer and Scherler (2023), and Courtial-Manent et al. (2024b, 2025) extend from Alaska to the Himalayas, with a concentration in the European Alps (Fig. 4). Differences in the application of the methodology (Table 1) are discussed in the following sections.
Table 1Comparative overview of the studies analyzing supraglacial sediments and the parameters. Glacial velocity: derived through satellite-based methods (satellite), literature review (biblio), numerical modeling (model), or past kinematic proxies (proxies). Source zones: identified using field-based and lithological observations (field), remote sensing (remote), numerical modeling (numeric), or temporal analyses (temporal). Concentration estimates during transport: obtained through approaches based solely on estimated velocity and transport distance (velocity), simplified dynamics models (simple), assumption of negligible transport time (no), comprehensive models integrating glacier dynamics and sediment transport (complex), or adapted formulations based on glacier mass balance (mass balance). Average erosion rate from the original study.
3.2 Supraglacial clast sampling
The clasts found on glacier surfaces exhibit a wide range of granulometry, from large blocks of several cubic meters to fine sand (Benn and Evans, 2010). This supraglacial load either is distributed broadly across the glacier's surface below the equilibrium line altitude (ELA) (Fig. 5a) or is concentrated on medial moraines, which run parallel to the direction of glacial flow (Fig. 5b). Medial moraines are longitudinal debris bands on a glacier's surface (Anderson, 2000), often formed when two neighboring glaciers merge (Small et al., 1979; Gomez and Small, 1985). Most 10Be studies focus on sampling these medial moraines due to the ease of collection and the rather straightforward identification of debris sources. Additionally, the lateral dispersion of debris from medial moraines (Kirkbride and Deline, 2013) contributes to clast mixing and exposes clasts as they are released through ablation. Nevertheless, at the Bossons glacier in the Western Alps, supraglacial clasts have been sampled considering that debris cover is minimal, and clasts are more widely scattered (Sarr et al., 2019).
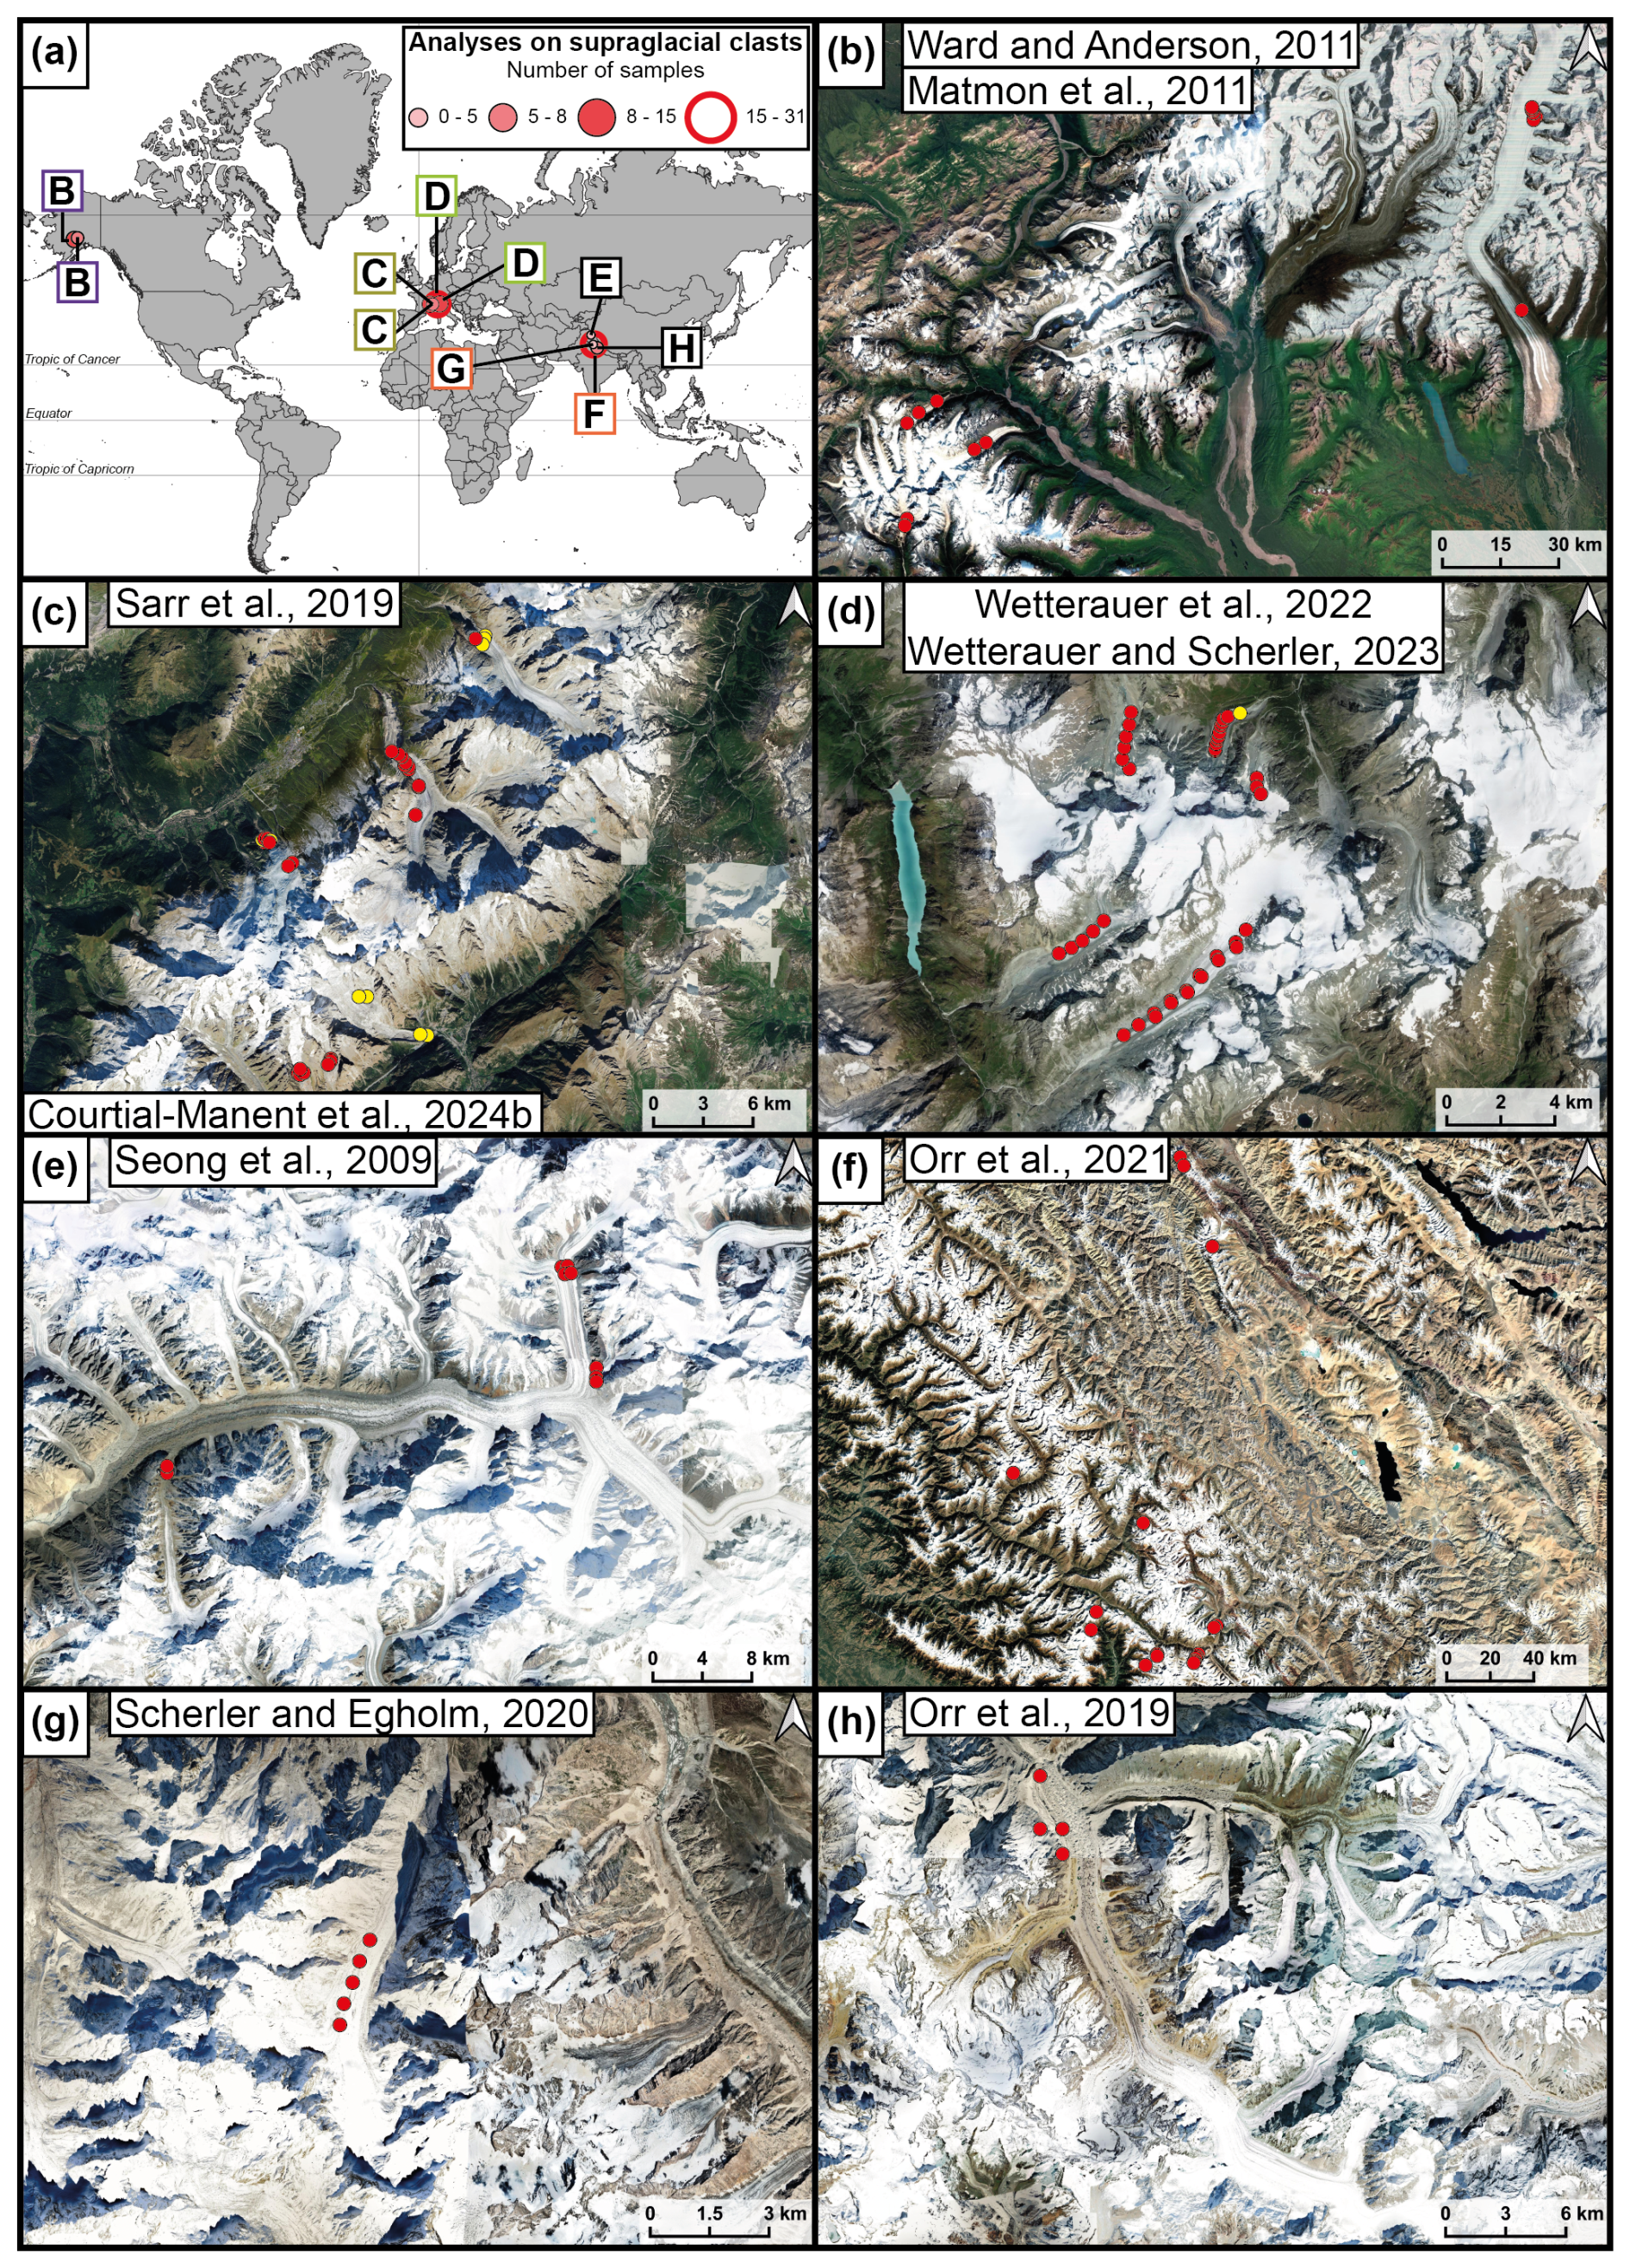
Figure 4Location of the different studies quantifying 10Be in supraglacial sediments. (a) Spread across the Northern Hemisphere (USA, France, Switzerland, Pakistan, and India). (b–h) Satellite images of the different sites, presented from west to east. Red dots: published samples; yellow dots: new samples from this study (see File FS1 for a visualization on © Google Earth 2024).
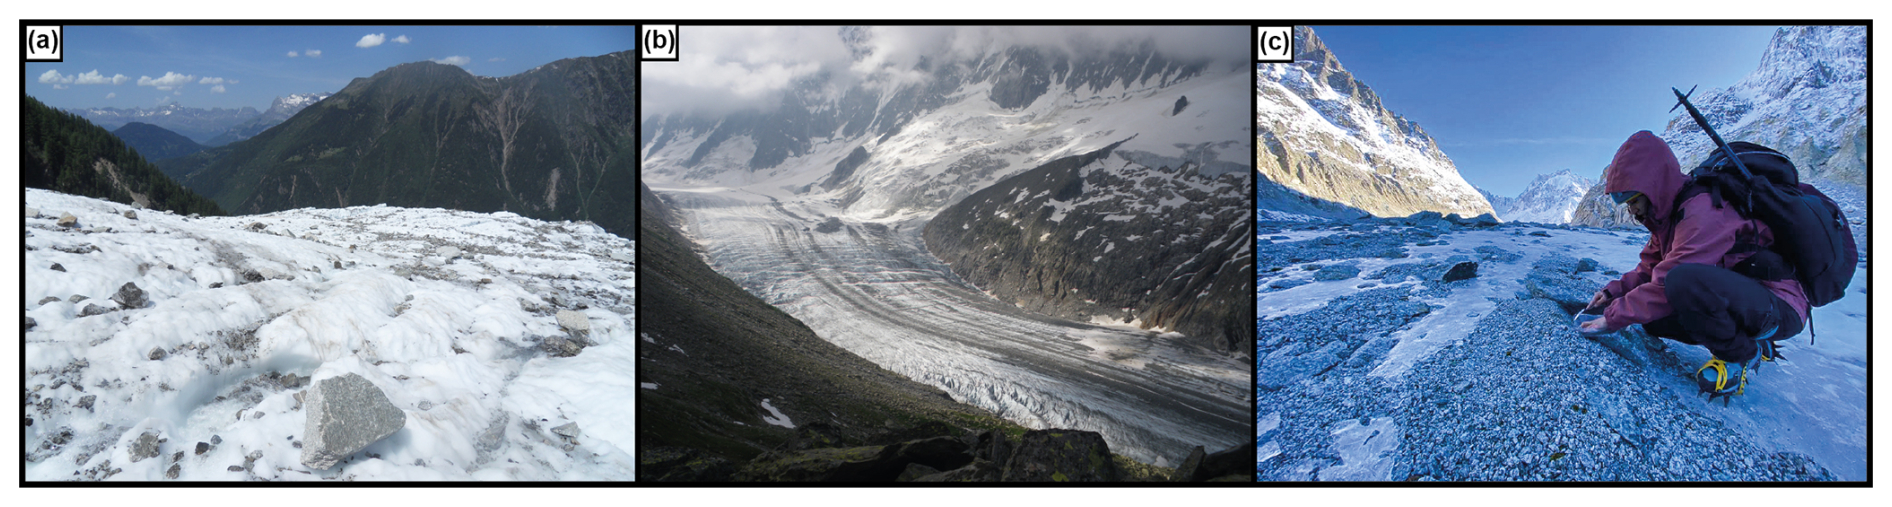
Figure 5(a) Dispersed supraglacial load at Mer de Glace (Western Alps); the first block is 60 cm long. (b) Medial moraines parallel to the glacial flow. (c) Supraglacial clast sampling.
Ward and Anderson (2011) were the first to describe the details of their field sampling strategy. They emphasized that amalgamating debris is essential to ensure the representative mixing of sources, enabling a balanced averaging of the stochastic distribution of 10Be concentrations from rockwall source areas. Ward and Anderson (2011) made an amalgam by collecting small rocks every ∼40 m until 30–40 chips were gathered while walking along a single medial moraine crest, which provided a relatively small rockwall source area.
Subsequent studies used a similar methodology with adaptations tailored to their specific study areas. Orr et al. (2019) sampled an area under 200 m2, while Sarr et al. (2019) collected samples within a circular area of roughly 20 m in diameter. Matmon et al. (2020) followed a sampling transect of 100–200 m by 30–40 m along the medial moraine. Scherler and Egholm (2020) collected samples from surface patches of approximately 5–10 m by 5–10 m, centered along the medial moraine. Wetterauer et al. (2022) and Wetterauer and Scherler (2023) collected samples from surface patches ranging from about 10 m by 30 m near debris source areas and glacier terminus to approximately 6 m by 20 m in the central glacier region where medial moraines narrow.
Courtial-Manent et al. (2025) collected samples (Fig. 5c) over broader zones than other studies, as they suggest that larger sampling areas help integrate material from large rockfalls evidenced in their study area. They sampled widths of approximately 50 m, with longitudinal transects between ∼150 and >600 m.
Most authors sample sand-to-pebble-sized clasts (generally between 1 mm and <3 cm), with Ward and Anderson (2011) and Sarr et al. (2019) also collecting small flakes from boulder-sized rocks. Sarr et al. (2019) and Wetterauer et al. (2022) studied the potential influence of sample size on 10Be concentration, sampling multiple granulometries. Unlike in a fluvial environment, where grain size may significantly affect concentrations (Carretier et al., 2015), these studies suggest that grain size is not a major control of 10Be concentration in supraglacial clasts. Therefore, sampling sand and gravel offers a straightforward approach to amalgamating supraglacial load over larger areas.
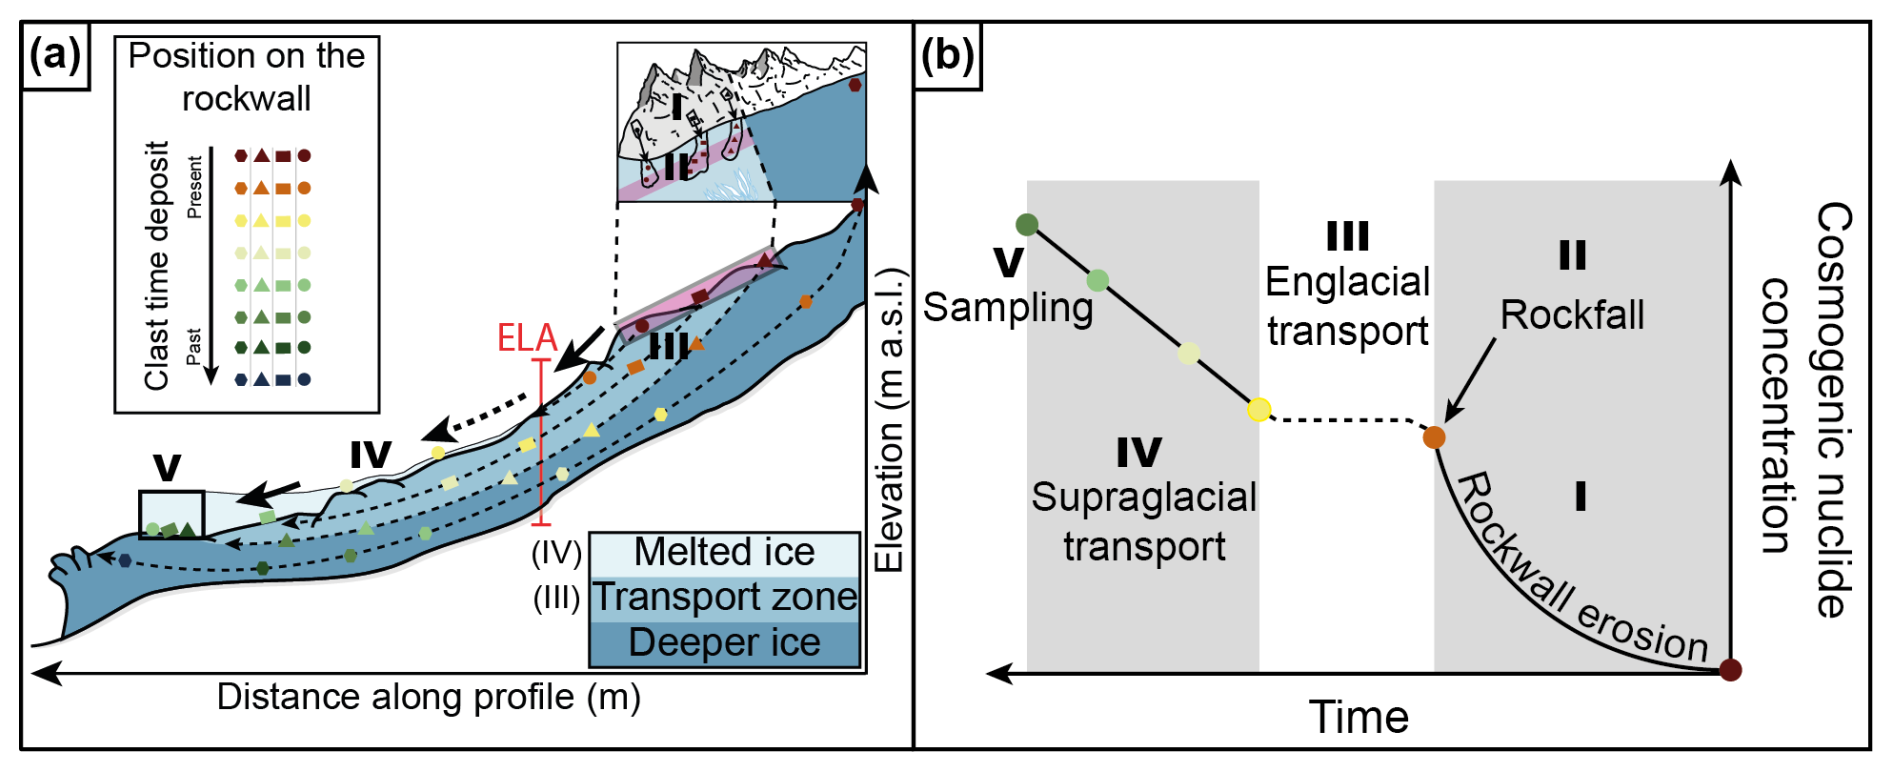
Figure 6The geomorphological system considered in this review. Roman numerals describe the same phases as Fig. 3: Roman numerals describe the different phases: (I) rockwall erosion, (II) rockfall, (III) englacial transport, (IV) surface transport on the glacier, and (V) sampling location. (a) 2D sketch of the supraglacial clasts transport (modified from Sarr et al., 2019). (b) Influence of the different processes involved in glacial transport on cosmogenic nuclide concentration (adapted from Scherler and Egholm, 2020).
3.3 Glacial transport of the debris
Supraglacial clasts may originate from upstream rockwalls but are also likely to be reworked rocks from lateral moraines (Orr et al., 2019). Understanding glacier transport is therefore essential for estimating the origin of supraglacial clasts, their duration of transport on the glacier surface, and the processes involved in clast amalgamation. Consequently, the methods used to estimate glacial velocities, glacier dynamics modeling, and clast trajectories were analyzed in the compiled studies examining 10Be in supraglacial clasts.
3.3.1 Clast transport general description
Glacier dynamics are mainly controlled by basal sliding and continuous flow deformation (Benn and Evans, 2010), with clast transport generally following englacial flow lines (Fig. 6). Transport can also occur vertically within the glacier: from the surface downward via englacial hydraulic flows (Guillon et al., 2017) or from the glacier's base upward through shear zones. These shear zones bring basal material to the surface where ice velocity decreases sharply downstream, particularly in the glacier's lower sections (Benn and Evans, 2010). Among the studies, only Orr et al. (2019) specifically identified such shear zones on the Bhagirathi glacier (Himalayas) and sampled at the hanging wall of these zones to exclude their influence. All other studies assumed that englacial transport of clasts occurs along flow lines, with supraglacial material originating exclusively from upward rockwalls. During the supraglacial transport phase, the clasts are assumed to be passively transported by the glacier (Fig. 6).
3.3.2 Data collection for estimating glacier transport dynamics
Field measurements of glacier velocity, ablation, and accumulation are essential inputs for glacier transport models. Some studies collected glacier velocity data directly via GPS during field campaigns or through feature tracking using aerial or satellite imagery (“satellite”, Table 1). Early work by Seong et al. (2009) and Ward and Anderson (2011) combined GPS measurements with feature tracking to determine mean annual velocities. More recently, Wetterauer and Scherler (2023) and Courtial-Manent et al. (2025) used a global glacier kinematics database derived from satellite imagery (Millan et al., 2022). Comparisons show that the velocities extracted automatically from satellites have a large uncertainty and, near the rockwalls of small or slow glaciers, an uncertainty as large as the velocity estimated from monitoring features in the field (Wetterauer and Scherler, 2023). Other studies used published velocity values (“biblio”, Table 1), including Orr et al. (2019), Sarr et al. (2019), and Matmon et al. (2020).
Past glacier velocities have also been studied (“proxies”, Table 1). Courtial-Manent et al. (2024b, 2025) used Forbes' band counting method (alternating light and dark bands that appear on the surface of some glaciers; Lliboutry and Reynaud, 1981) to estimate the long-term glacier motion. Wetterauer and Scherler (2023) reconstructed historical glacier velocities by first manually tracking the displacement of medial moraine blocks on ortho-images and then deriving velocity changes by linear interpolation from 1977 to 2020. To estimate velocities between 1880 and 1977, they aligned the gradient of velocity change with that of glacier length changes inferred from paleo-moraine records. Their work highlights that earlier velocity estimates involve greater uncertainty. However, glacier velocities have been reduced by a factor of 3 in less than 50 years (Wetterauer and Scherler, 2023; Courtial-Manent et al., 2025), underscoring the need to account for these decreases, despite the significant challenge involved.
3.3.3 Models for clast trajectories during glacial transport
The surface velocity vectors derived from satellite images (e.g., Millan et al., 2022) have limitations in defining flow-line trajectories due to high uncertainty in vector orientation. Therefore, transport times are calculated from satellite-derived velocities (“satellite”, Table 1) but are modeled along longitudinal profiles deduced from mapped moraine transport paths, which serve as the basis for determining flow lines in all the studies. Mapping moraines can be challenging, especially on glaciers with complex geometries, seracs, or multiple upstream tributaries, such as the Tsijiore Nouve glacier (Swiss Alps; Wetterauer and Scherler, 2023) and Mer de Glace (Western Alps; Courtial-Manent et al., 2024b, 2025).
In complex geometries and above the ELA, alternative methods are needed for modeling transport dynamics. Ward and Anderson (2011) developed an idealized glacier model reused by Orr et al. (2019, 2021). Wetterauer et al. (2022) also developed a simple 1D debris particle trajectory model based on glacier mass balance (Benn and Evans, 2010), incorporating transport distance and surface velocity, later used by Wetterauer and Scherler (2023). Finally, Courtial-Manent et al. (2025) built the longitudinal profiles above the ELA using GIS-based routines that analyze the steepest surface slope. Additionally, automatic geomorphological tools, such as the D-Infinity flow direction in QGIS, applied to high-resolution DEMs (∼1 m, e.g., RGE ALTI®, IGN), help identify lines that align with flow directions (Courtial-Manent et al., 2025), providing a complementary approach to manual moraine mapping. Further, Courtial-Manent et al. (2025) quantified the influence of ablation on clast exposure at the glacier surface downstream and estimated both total transport time and surface exposure duration.
Scherler and Egholm (2020) used a different approach, based on full-Stokes mechanical modeling (e.g., Benn and Evans, 2010) (“model”, Table 1), to calculate flow lines and better constrain ice dynamics and supraglacial sediment transport pathways. By integrating particle tracking within the ice, this method estimates the position of a clast on the glacier from its initial point of incorporation into the ice (Jouvet and Funk, 2014). Specialized software now enables this modeling for both glaciers (Scherler and Egholm, 2020) and debris-covered glaciers (Anderson et al., 2018), estimating supraglacial exposure times based on particle trajectory and velocity. However, these models presently use shallow ice approximations (Hindmarsh, 2004), which may underrepresent the transverse components of glacier kinematics and introduce bias. Additionally, these models require parameters not commonly available, rendering their application somewhat empirical (Wetterauer and Scherler, 2023).
3.4 Rockfall phase and rockwall source determination
In simple glaciated catchments, such as those studied by Orr et al. (2021), the entire catchment is considered a source of supraglacial clasts. For well-defined transported moraines, the moraines were traced using field-based observations (“field”, Table 1; Sarr et al., 2019) or remote sensing data by most of the authors (“remote”, Table 1). The clast source zones were visually determined from ice-free rockwalls overhanging the glacial confluence, from which transported moraines developed.
Wetterauer et al. (2022) and Wetterauer and Scherler (2023) also estimated temporal changes in source zone boundaries (“temporal”, Table 1). These changes, which are influenced by historical evolution in glacier apron extents, were analyzed using historical archives.
In most cases, it is assumed that rock deposits accumulate directly at the base of the rockwall, and the fall trajectory is generally disregarded. This assumption is partially justified by the presence of a bergschrund – a crevasse at the glacier boundary – into which clasts can fall. However, for larger rockfalls, this assumption appears unrealistic, as these events often overfill the bergschrund and extend significantly across the glacier surface (Fig. 7a and c).
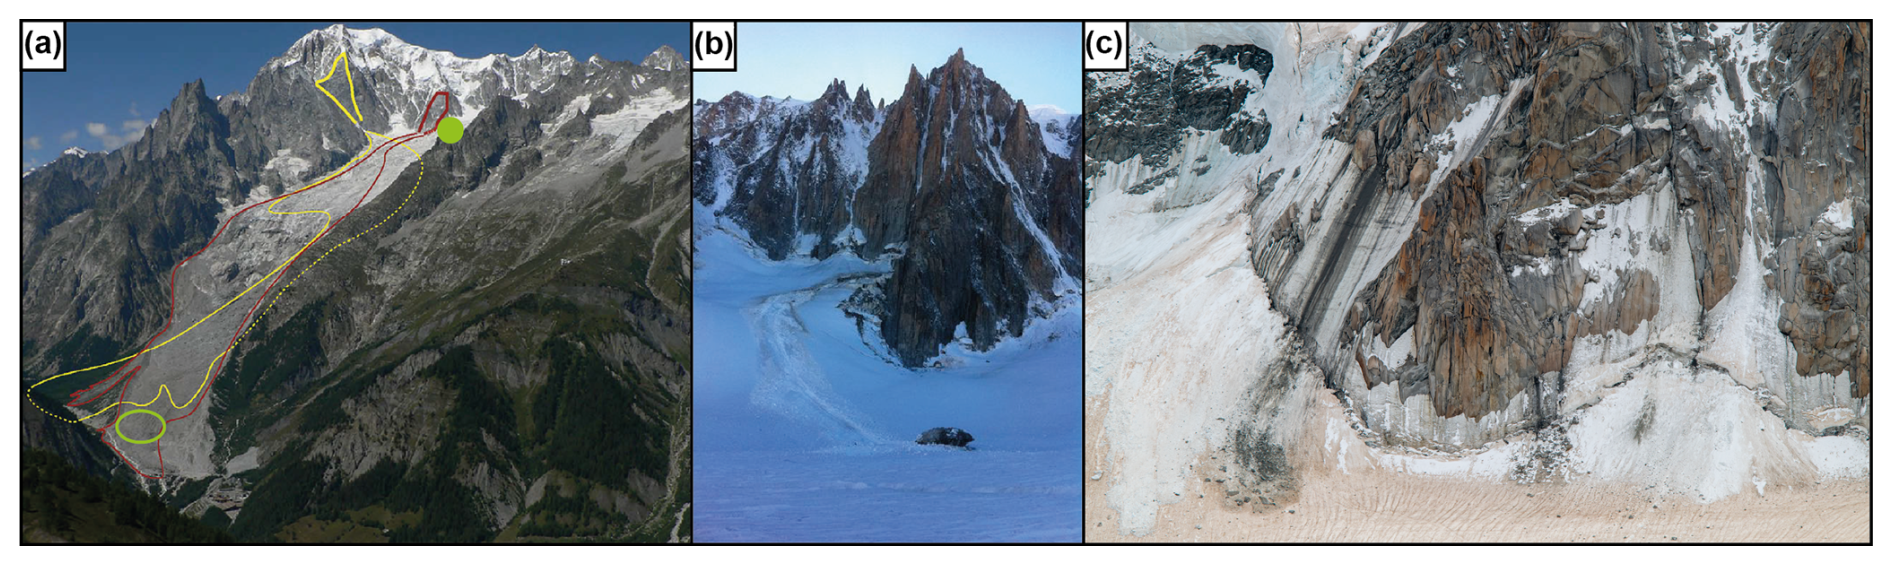
Figure 7Examples of rockfalls in the Mont-Blanc massif (Western Alps). (a) The Brenva very large rockfalls (greater than 106 m3, from Deline et al., 2015). Yellow: boundaries of the 1920 rockfall; red: boundaries of the 1997 rockfall; green circle: location of 10Be sampling of the 1997 rockfall ( at g−1); green dot: supraglacial clasts ( at g−1) (see Table S1). (b) A rockfall formed of one block and sliding on the glacier (credits: Compagnie des Guides de Chamonix). (c) Rockfalls that partly fill the bergschrund and partly slide on the glacier. The left rockfall extends ∼50 m onto the glacier.
To estimate the extent of rockfall deposits, several models were used. The linear diffusion model, commonly used in hillslope studies (Beaumont et al., 1992), has been applied to transport particles formed at headwalls down to the ice surface below (Scherler and Egholm, 2020). However, this trajectory model does not account for the effect of rockfall size on propagation distance. Alternatively, statistical methods for estimating rockfall propagation areas (Cathala et al., 2024), fed by rockfall catalogs from the French Alps (Ravanel and Deline, 2013), offer a more realistic estimate of the extent of deposits on glacier surfaces (Courtial-Manent et al., 2025).
Rockfall production, or sediment generation, is determined by the initial spatial distribution of rock compartments within the rockwall (Hantz et al., 2021). Various assumptions are used to model sediment production: Scherler and Egholm (2020) suggest it is proportional to slope (Beaumont et al., 1992), while other studies spatially distribute production based on parameters from frost-cracking models (Anderson et al., 2015). The temporal and volume distributions of rockfalls, which follow power laws (Ward and Anderson, 2011), cannot be directly accounted for in rockfall production but imply averaging the erosion rate on a timescale corresponding to the recurrence time of the larger rockfall event (Courtial-Manent et al., 2025).
3.5 10Be erosion rate
The average erosion rate is calculated in all studies using Eq. (2) (Granger et al., 1996), which requires the measurement of 10Be concentrations and an estimate of the mean 10Be production in the rockwall. Additionally, most studies include an extra term that accounts for the 10Be production during supraglacial transport.
3.5.1 10Be concentration measurement
Sample preparation protocols for extracting 10Be concentrations are now well-established, with details of the methods and parameters available in each respective publication. In the summary table (Table S1), we provide a brief overview, noting the quartz mass used for measurement, the calculated 10Be concentration, and the associated 1σ analytical uncertainty.
Furthermore, this study includes 10 new samples: three samples from Argentière glacier (French Alps), three from Bossons glacier (French Alps), one from Tsijiore Nouve (Swiss Alps), and three from the 1997 very large rockfall (Deline et al., 2015) at Brenva glacier (Italian Alps, Fig. 7a). The details of these new sample analyses and the data are not yet publicly available (Courtial-Manent et al., 2024b) and are provided in Sect. S3.
3.5.2 10Be production rates in rockwalls
Measurement accuracy, including 10Be production rates, is continuously refined by the TCN community. Early studies on supraglacial clasts in the 2000s used a higher sea level high-latitude (SLHL) 10Be production rate in quartz than those in recent studies, with rates varying from 4.5 (Ward and Anderson, 2011) to 4.01 at g−1 yr−1 (Wetterauer and Scherler, 2023) (Table 1b).
Additionally, models to calculate cosmogenic nuclide production require careful selection (Dunai, 2010; Lifton et al., 2014) of the relevant scaling factors linked to topographic shielding (Norton and Vanacker, 2009), as well as the latitude and altitude distribution of eroded surfaces (Dunne et al., 1999).
Topographic shielding reduces cosmic radiation flux on samples with slope or skyline obstructions (Dunne et al., 1999), and corrections are often applied. Most studies corrected production rates per DEM cell by calculating individual topographic shielding values. In particular, Scherler and Egholm (2020), Wetterauer et al. (2022), and Wetterauer and Scherler (2023) used the TopoToolbox (Schwanghart and Scherler, 2014) and the online calculator CRONUS v2.3 (Balco et al., 2008; Borchers et al., 2016) to compute production rates and correct for topographic shielding. Nonetheless, Seong et al. (2009) calculated a single shielding value at the catchment mid-point, whereas Courtial-Manent et al. (2025) did not apply a topographic shielding correction, following DiBiase (2018). Indeed, standard shielding algorithms ignore the effect of oblique cosmic ray irradiation at depth (Codilean, 2006), which can result in an underestimation of erosion rates by up to 20 % (DiBiase, 2018). Accurate estimation of irradiation geometry requires complex numerical simulations (Masarik et al., 2000), currently in partial development (Scherler and Egholm, 2020). Given the opposing impacts of topographic shielding and oblique cosmic ray irradiation on erosion rate estimates, omitting both corrections may provide a closer approximation than addressing just one (Wang and Willett, 2021; Courtial-Manent et al., 2025).
The 10Be production rate strongly increases with altitude according to an exponential law (Dunai, 2010). Seong et al. (2009) initially calculated a 10Be production rate based on the area–altitude distribution of rockwalls across the entire catchment. All other studies calculated the 10Be production rate by considering the altitude of each cell in DEMs with resolutions of 25 to 43 m and averaging the rates of the cells within the rockwall source zone. As the altitude strongly influences the 10Be production rate, uncertainties in the altitude of the source zone introduce a significant source of error in 10Be erosion rate estimates in rockwalls.
3.5.3 Estimation of the 10Be concentration acquired during supraglacial transport
The 10Be component acquired during supraglacial transport has been estimated through various models. When glaciers flow very fast, it is deemed negligible (“no”, Table 1; Sarr et al., 2019), as for the Bossons glacier (Western Alps), where the local velocity can exceed 1 m d−1 (Godon et al., 2013). For slower glaciers, different approaches have been employed: a transport time estimated as the product of mean glacier velocity and transport distance (“velocity”, Table 1; Seong et al., 2009); from analytical transport models, as developed by Ward and Anderson (2011) and subsequently applied by Orr et al. (2019, 2021) (“simple”, Table 1); from a clast transport model adapted from glacier mass balance data (“mass balance”, Table 1; Wetterauer et al., 2022; Wetterauer and Scherler, 2023; Courtial-Manent et al., 2025); or from a complex numerical model combining glacier dynamics with clast transport (“complex”, Table 1; Scherler and Egholm, 2020).
Wetterauer and Scherler (2023) found that for glaciated catchments where transport distances are short, glacier velocities are high, and rockwall 10Be concentrations are elevated due to low erosion rates, the additional 10Be accumulation during supraglacial transport remains minimal or even negligible. The significance of 10Be production during transport (Cg) can be approximated at first order (Courtial-Manent et al., 2025) by the following equation:
where Pmt is the nuclide production rate at the average elevation of the glacier below the ELA, and Tt is the ice transport duration from the ELA. This formula can be universally applied to estimate 10Be accumulation during transport for glaciers worldwide, as global estimates for velocity (Millan et al., 2022) and ELA elevation (Davaze et al., 2020) are available in global databases (https://www.theia-land.fr/en/blog/ceslist/glaciers-sec/, last access: August 2025).
3.6 Uncertainty and robustness of the supraglacial clast method with stochastic rockfalls
3.6.1 Number of possibly amalgamated rockfalls
Ward and Anderson (2011) provided a foundational analysis using Monte Carlo simulations to evaluate errors when applying a steady-state erosion model to stochastic rockfall events. They calculated 10Be concentrations for a theoretical sample composed of 30 clasts, where the clast accumulation followed a power law distribution based on rockfall thickness. They show that the calculated concentration asymptotically approaches the average concentration of the rockwall surface when small rockfalls are dominant (i.e., when the power law exponent exceeds 1). Even for large rockfall with thickness up to 100 m, the concentration underestimate remains under 20 % for typical power law exponents (Ward and Anderson, 2011). Applying Ward and Anderson's (2011) methodology to the Mont-Blanc massif (Western Alps) – where the statistical distribution of rockfall size is known (Ravanel et al., 2010; Ravanel and Deline, 2011) and includes large rockfalls up to 50 m thick (Deline et al., 2012) – suggests that the average 10Be concentration of 30 clasts exceeds 95 % of the concentration calculated with Eq. (2) (Sarr et al., 2019).
Robustness, which refers to the method's capacity to downweight and flag possible outliers, is often approached in supraglacial clast studies by estimating the probable number of rockfalls sampled on the glacier surface: a greater number of statistically amalgamated rockfalls indicates increased robustness in the results.
Findings indicate that each sample likely amalgamates between 10 (Orr et al., 2019) and 140 rockfalls exceeding 1 m3 (Courtial-Manent et al., 2025). For samples statistically amalgamating fewer than 30 rockfalls and insufficiently representative of the rockwall's overall concentration (Ward and Anderson, 2011), a more robust erosion rate estimate can be obtained by averaging the concentration of multiple samples, which collectively amalgamate a greater number of rockfalls (Sarr et al., 2019).
The number of rockfalls sampled has been estimated empirically (Orr et al., 2019) or through analytical approaches (Sarr et al., 2019; Courtial-Manent et al., 2025). These approaches consistently show that robustness declines with increasing glacier speed and increases with a larger glacier sampling surface, greater downstream distance from the ELA, and larger rockwall dimensions. Moreover, the number of statistically amalgamated rockfalls is positively correlated with erosion intensity: stronger erosion facilitates more robust results in 10Be concentration measurements from clasts.
3.6.2 Consideration of very large rockfalls in erosion rate estimation
Biases may occur if sampling is carried out at a single deposit associated with a specific rockfall event, particularly a large one (Kober et al., 2012). In this case, such bias may be greater than the erosion rate estimates derived from individual samples (Small et al., 1997). For example, the very large 1997 rockfall at Brenva (Western Alps; Deline et al., 2015) illustrates this effect: the concentration from this rockfall, inferred from amalgamated sand over an area of around 10 000 m2, is only at g−1, i.e., less than one-third of the concentration of supraglacial clasts ( at g−1) sampled above the rockfall elevation (Fig. 7a; Table S1).
The recurrence of rockfall volumes is generally assumed to follow a Poisson statistical distribution (e.g., Hantz et al., 2021). Courtial-Manent et al. (2025) compared the number of rockfalls statistically amalgamated in 10Be samples with those inventoried in the Mer de Glace region (Western Alps), estimating that their supraglacial samples amalgamate only ∼10 years of rockfall production in the Mer de Glace rockwalls. Consequently, rockfalls with a recurrence interval exceeding ∼10 years are not statistically captured when estimating erosion rates via 10Be concentration, leading to an underestimation of long-term erosion rates.
The absence of rare, very large rockfalls thus biases erosion rate calculations towards lower values. If extreme rockfall events – such as the major Brenva rockfall (Fig. 7a) – are considered to follow the same power law distribution as smaller events, then long-term erosion rate estimates could almost double (Courtial-Manent et al., 2025). However, such large volumes may fall outside the valid range for power law distributions (Coles, 2004). Therefore, while 10Be-based erosion rates account for extended historical periods, they may not fully represent true long-term erosion.
3.6.3 Uncertainty estimation of the erosion rate
The inherent complexity of glacial transport systems introduces significant uncertainty into the interpretation of 10Be concentration measurements in clasts, with cumulative uncertainty arising from multiple stages of the transport process. One major source of uncertainty is the stochastic nature of TCN production (Ward and Anderson, 2011). Another arises from the difficulty in precisely identifying the source zones of the sampled clasts. Additional uncertainty stems from the 10Be production rate, including both shielding factors and physical parameters. Finally, the analytical uncertainty related to 10Be concentration measurements accounts for only a small part of the total uncertainties. Taken together, these factors can yield uncertainty estimates as high as 80 % for the erosion rate (Courtial-Manent et al., 2025). In the absence of standardized reporting practices across supraglacial studies, a moderate uncertainty estimate of 50 % is applied in the current discussion.
4.1 Comparison of the measured concentration
In the corpus of published articles (Fig. 8, Table S1), the number of samples collected and analyzed per glacier varies between 1 and 15, the latter recorded for the Otemma glacier in Switzerland (Wetterauer et al., 2022). The 10Be concentration in supraglacial clasts spans 3 orders of magnitude, ranging from 0.17×10⁴ at g−1 for the Tsijiore Nouve glacier (Swiss Alps; Wetterauer and Scherler, 2023) to 260×104 at g−1 for the Karzok glacier in the northern Himalayas (Orr et al., 2021). This wide range of values appears to be related to the dynamics of glaciers and rockfalls, which induces dispersion over approximately 1 order of magnitude, whereas the remaining 2 orders of magnitude in dispersion are likely associated with the geographic, geodynamic, and climatic characteristics unique to each studied glacier (Fig. 9).
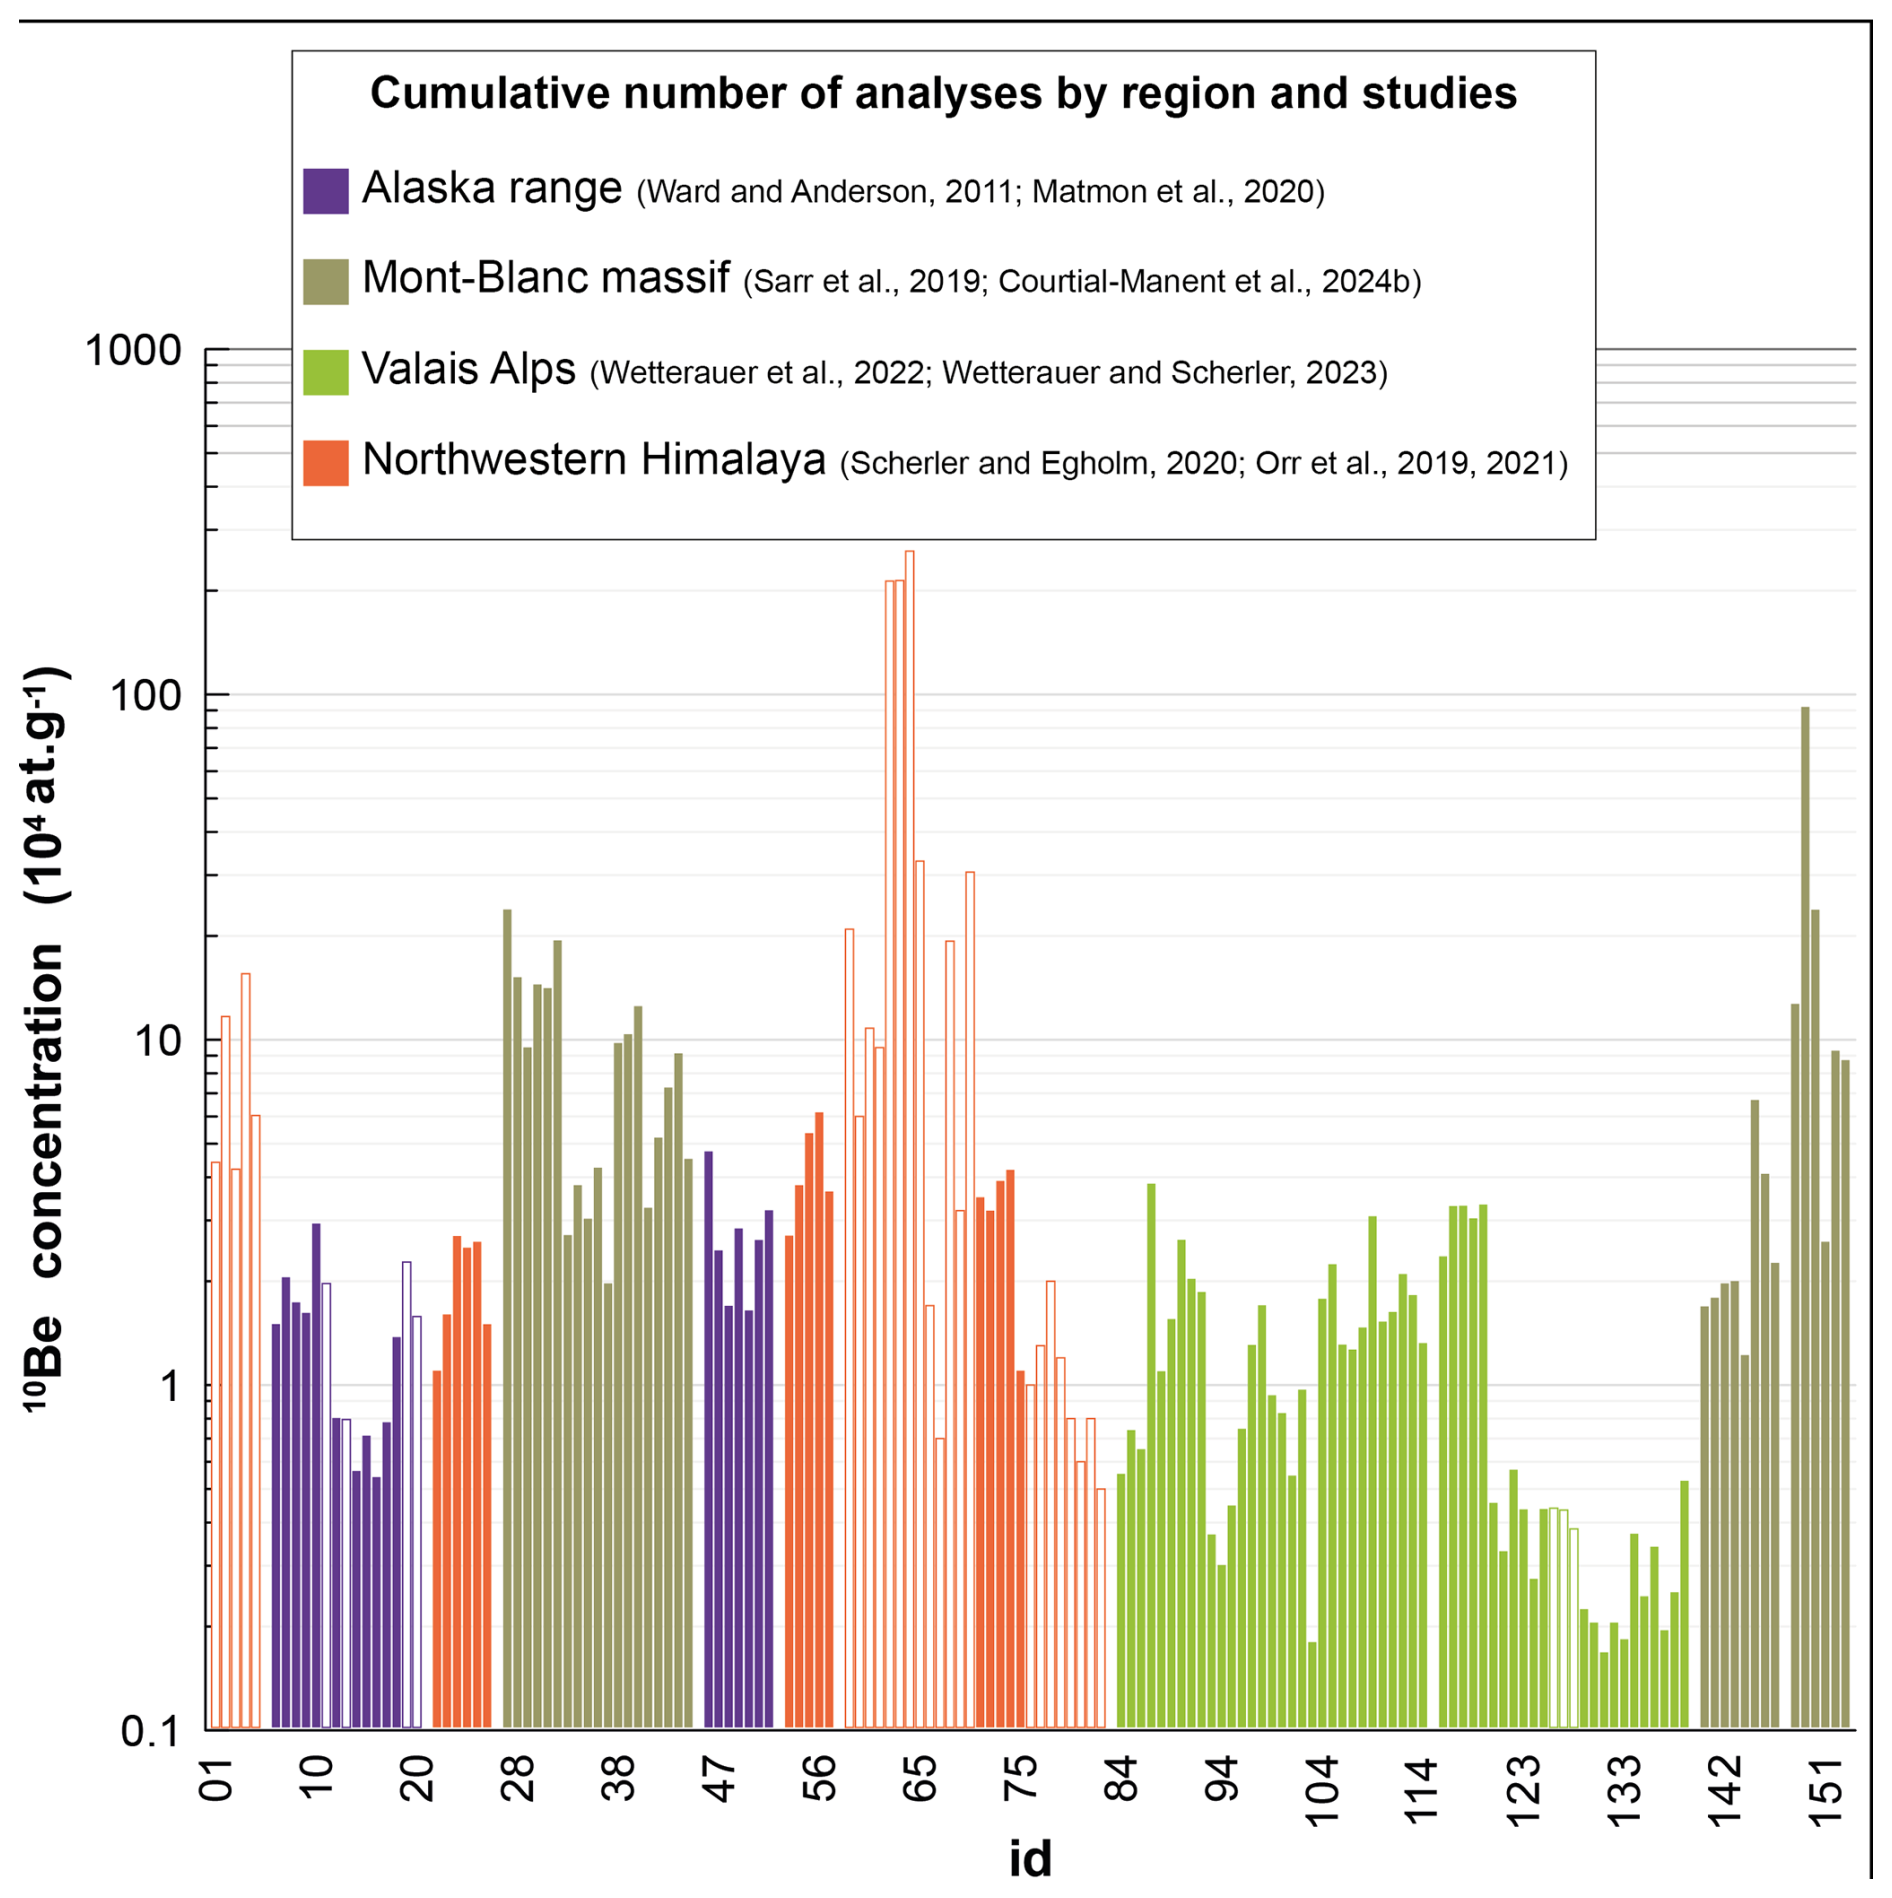
Figure 8Comparison of all the measured 10Be supraglacial concentrations. Each color refers to a study. Solid columns: at least five samples were taken from one glacier. Outlined columns: fewer than five samples were taken from a glacier. The x axis refers to individual 10Be analysis; the ID number can be found in Table S1.
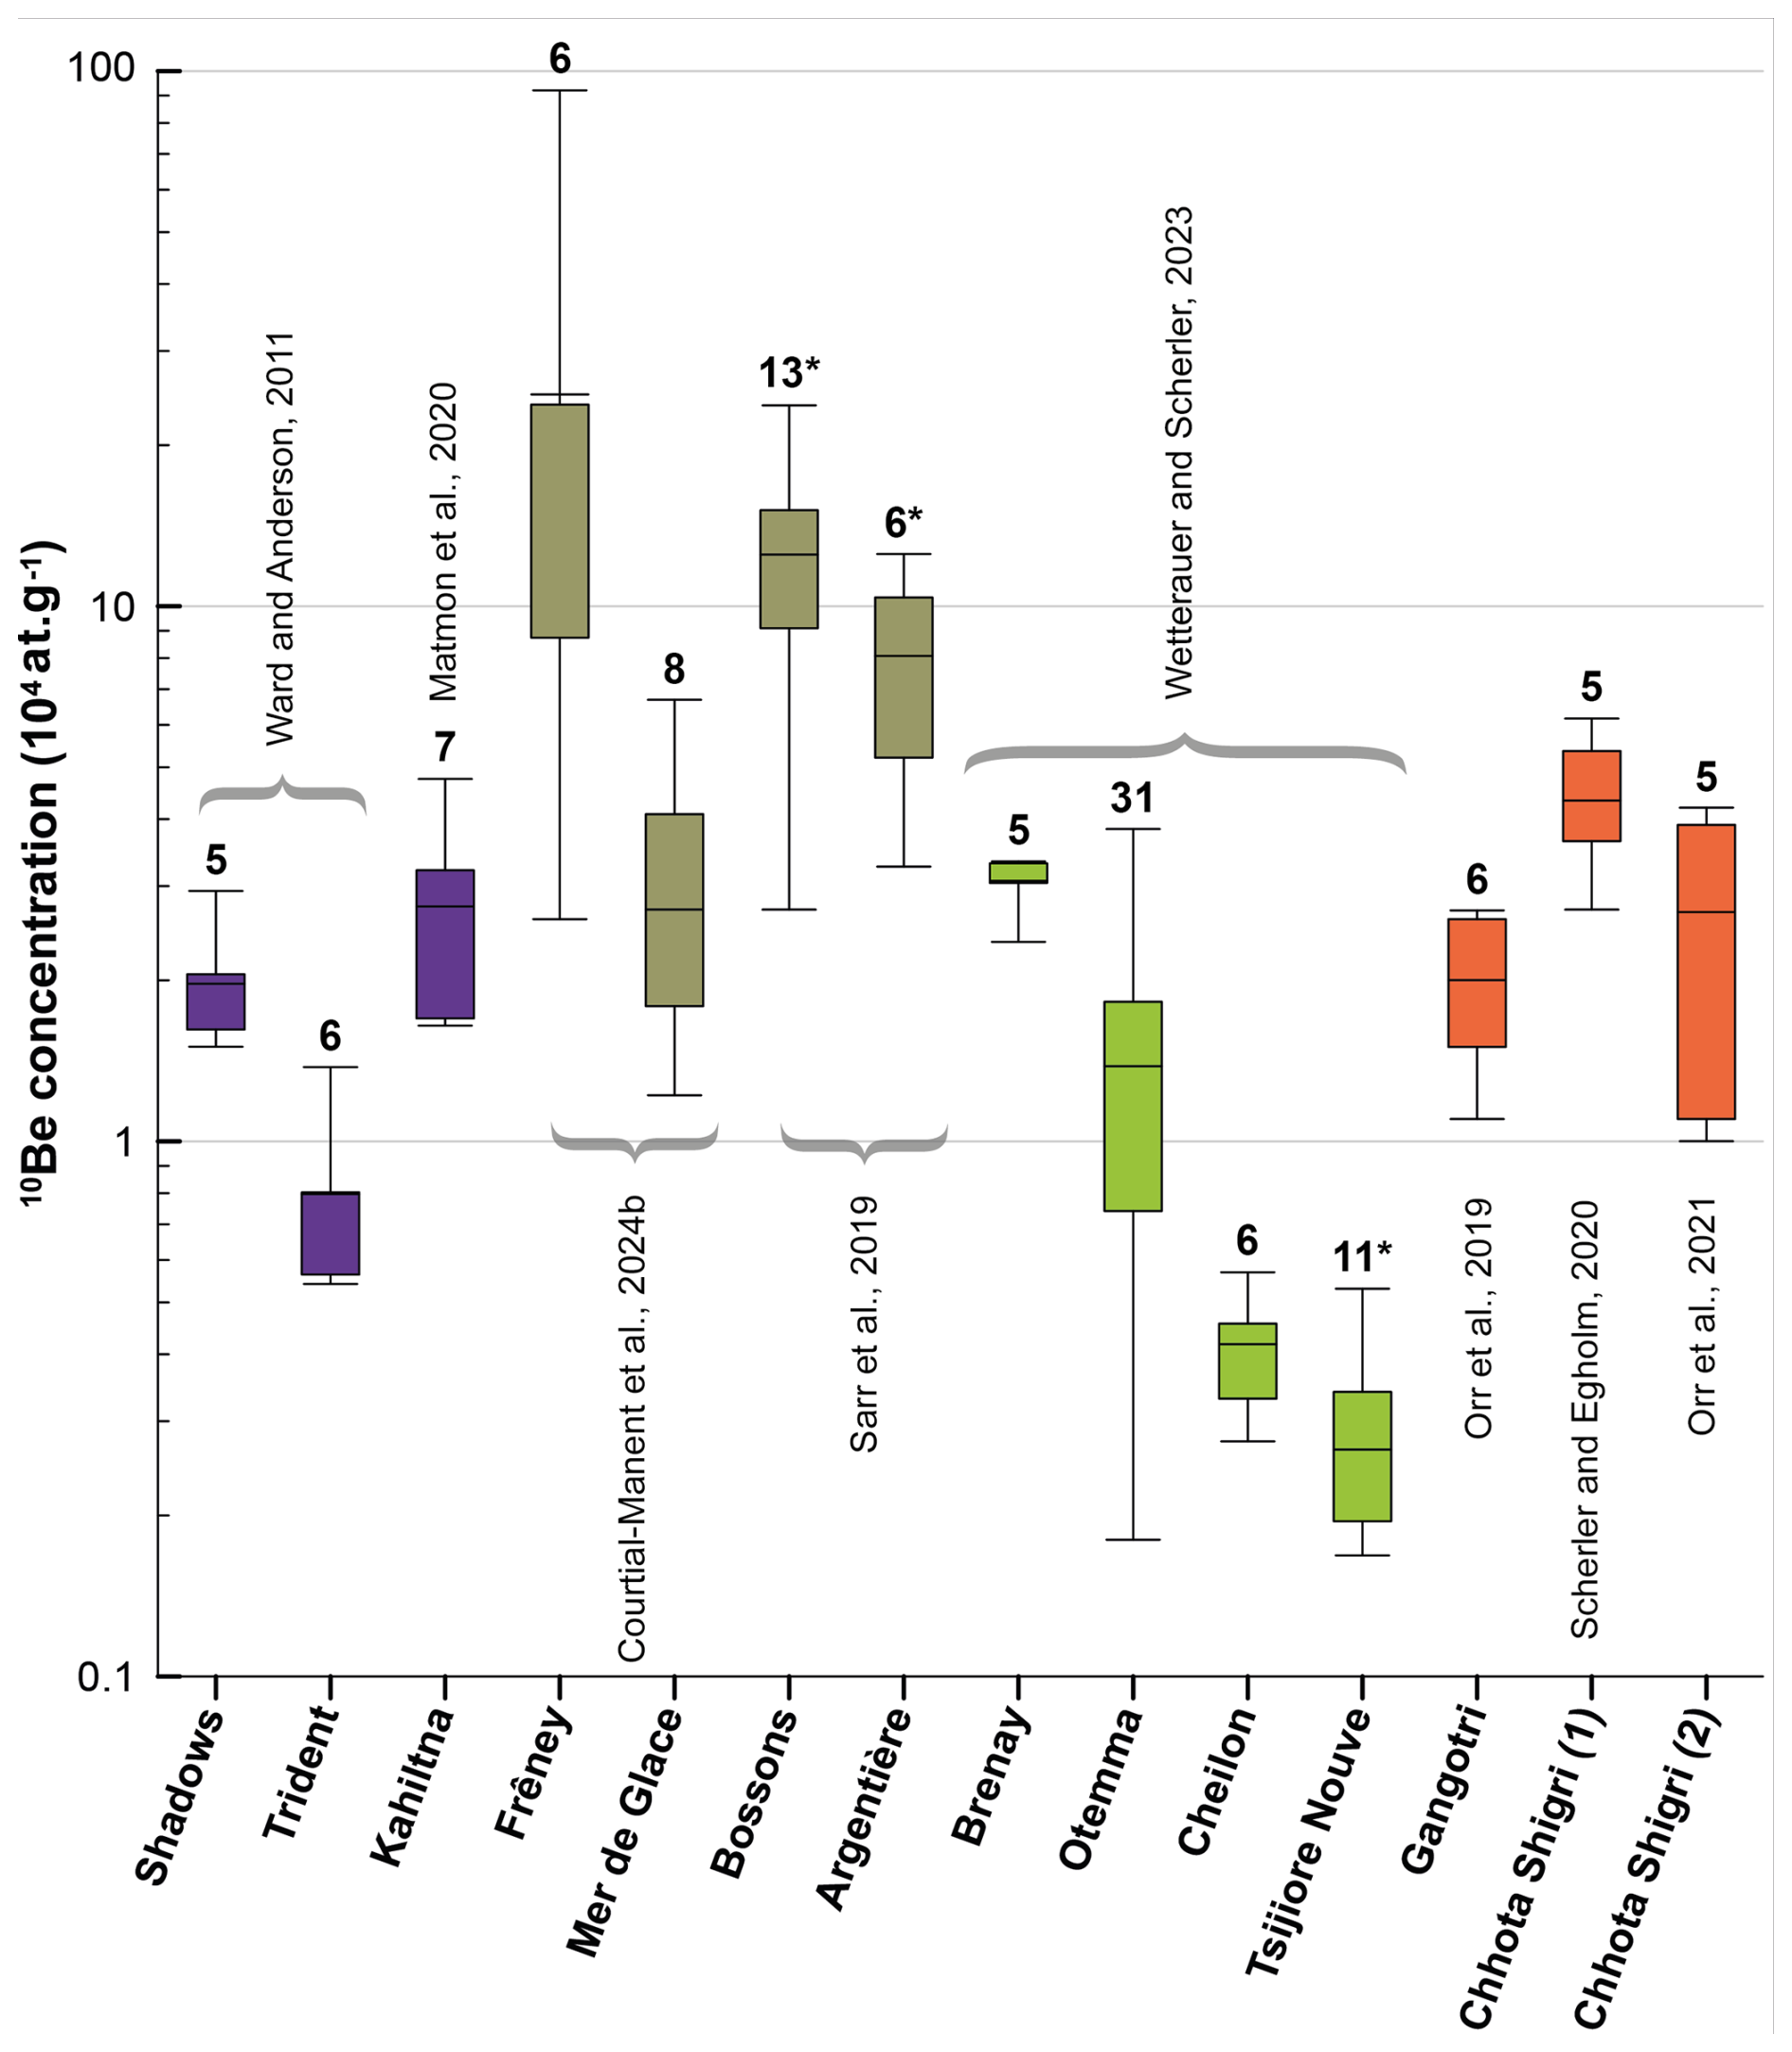
Figure 9Comparison of results from the 13 glaciers with at least five 10Be samples. Glaciers are organized from west to east. Purple: Alaska; green: the European Alps; orange: the Himalayas. Numbers above the whisker box: number of analyses carried out. Asterisks (*): glaciers where we have carried out additional analyses, presented in Table S1.
Comparisons of concentration measurements on the same glacier, where five or more samples were analyzed, generally reveal substantial dispersion – up to nearly 1 order of magnitude, as observed on the Bossons glacier (France; Fig. 9). Brenay glacier (Switzerland) displayed the least concentration variability, with values between 2.3 and 3.3×10⁴ at g−1; Wetterauer and Scherler, 2023). A trend towards increasing 10Be debris concentration downstream, suggested for the Otemma Glacier (Wetterauer et al., 2022), is of the order of 3 but is not systematic. For other glaciers, measured concentrations fluctuate by over a factor of 4. Notably, the Chhota Shigri glacier (northern India) was examined by two studies (Orr et al., 2021; Scherler and Egholm, 2020) that indicate a dispersion of the whole dataset not greater than that of other glaciers.
In places where various granulometries were simultaneously sampled, no significative difference in 10Be concentrations of the amalgams was observed. For the Bossons glacier, the order of the sand, gravel, and pebble concentrations varies, and their concentration ratios are less than 2 (Sarr et al., 2019). For the Otemma glacier, coarse-grained samples (4–22.4 mm) exhibited lower concentrations than fine-grained ones (0.125–4 mm), but the ratio between the two concentrations generally varies from a factor of less than 2 (Wetterauer et al., 2022).
Given the observed dispersion in 10Be concentrations within individual glacier catchments, we recommend collecting multiple clast measurements across different supraglacial flow paths and debris sources to better account for spatial heterogeneity and improve the reliability of exposure interpretations.
4.2 Rockwall erosion estimates
No erosion rate was estimated for sites with fewer than five 10Be measurements, and the mean 10Be-derived erosion rate was estimated for the other study sites based on the average concentration of all available 10Be measurements. This approach mitigates the variability within single rockfall scars, where 10Be concentrations may fluctuate significantly across a rockwall (Gallach et al., 2020). Averaging multiple concentrations thus provides a more reliable estimate of overall rockwall erosion. In contrast, individual concentration measurements can be skewed by the stochastic nature of rockfalls, rendering them less representative in isolation (Small et al., 1997).
Erosion rates were calculated using the production rate initially estimated in each published study. Due to the often insufficiently described source zones, we did not attempt to standardize production rates at the rockwall scale across studies. Additionally, since methodologies for estimating supraglacial 10Be production vary, we disregarded the supraglacial contribution to 10Be concentration, as it is minimal in most cases compared to the concentration produced within rockwalls. This approach may lead to a minor underestimation of the erosion rate. The erosion rate (change of the topographic surface altitude at a constant geographic location) is presented for each study site (Fig. 10). For sites where only rockwall retreat rates were estimated in the initial studies, we calculated the vertical erosion rate (ε) using the following Eq. (4):
where Rr is the retreat rate, and α is the mean rockwall slope. Due to the variability in methodologies across studies, we applied a conservative uncertainty estimate of 50 % (Fig. 10). This accounts for an approximate 20 % bias in the parameters affecting TCN production and the 10Be production rate at SLHL (Table 1b), another 20 % from uncertainties in source zone identification and production rate, and ∼10 % analytical uncertainty. For the Baltoro glacier system (Seong et al., 2009), 14 samples were distributed along seven tributaries. While this distribution precludes a detailed analysis of concentration dispersion within individual tributaries, it allows for an averaged 10Be-derived erosion rate for the entire glacier system, estimated between 1 and 3.5 mm yr−1 (Fig. 10).
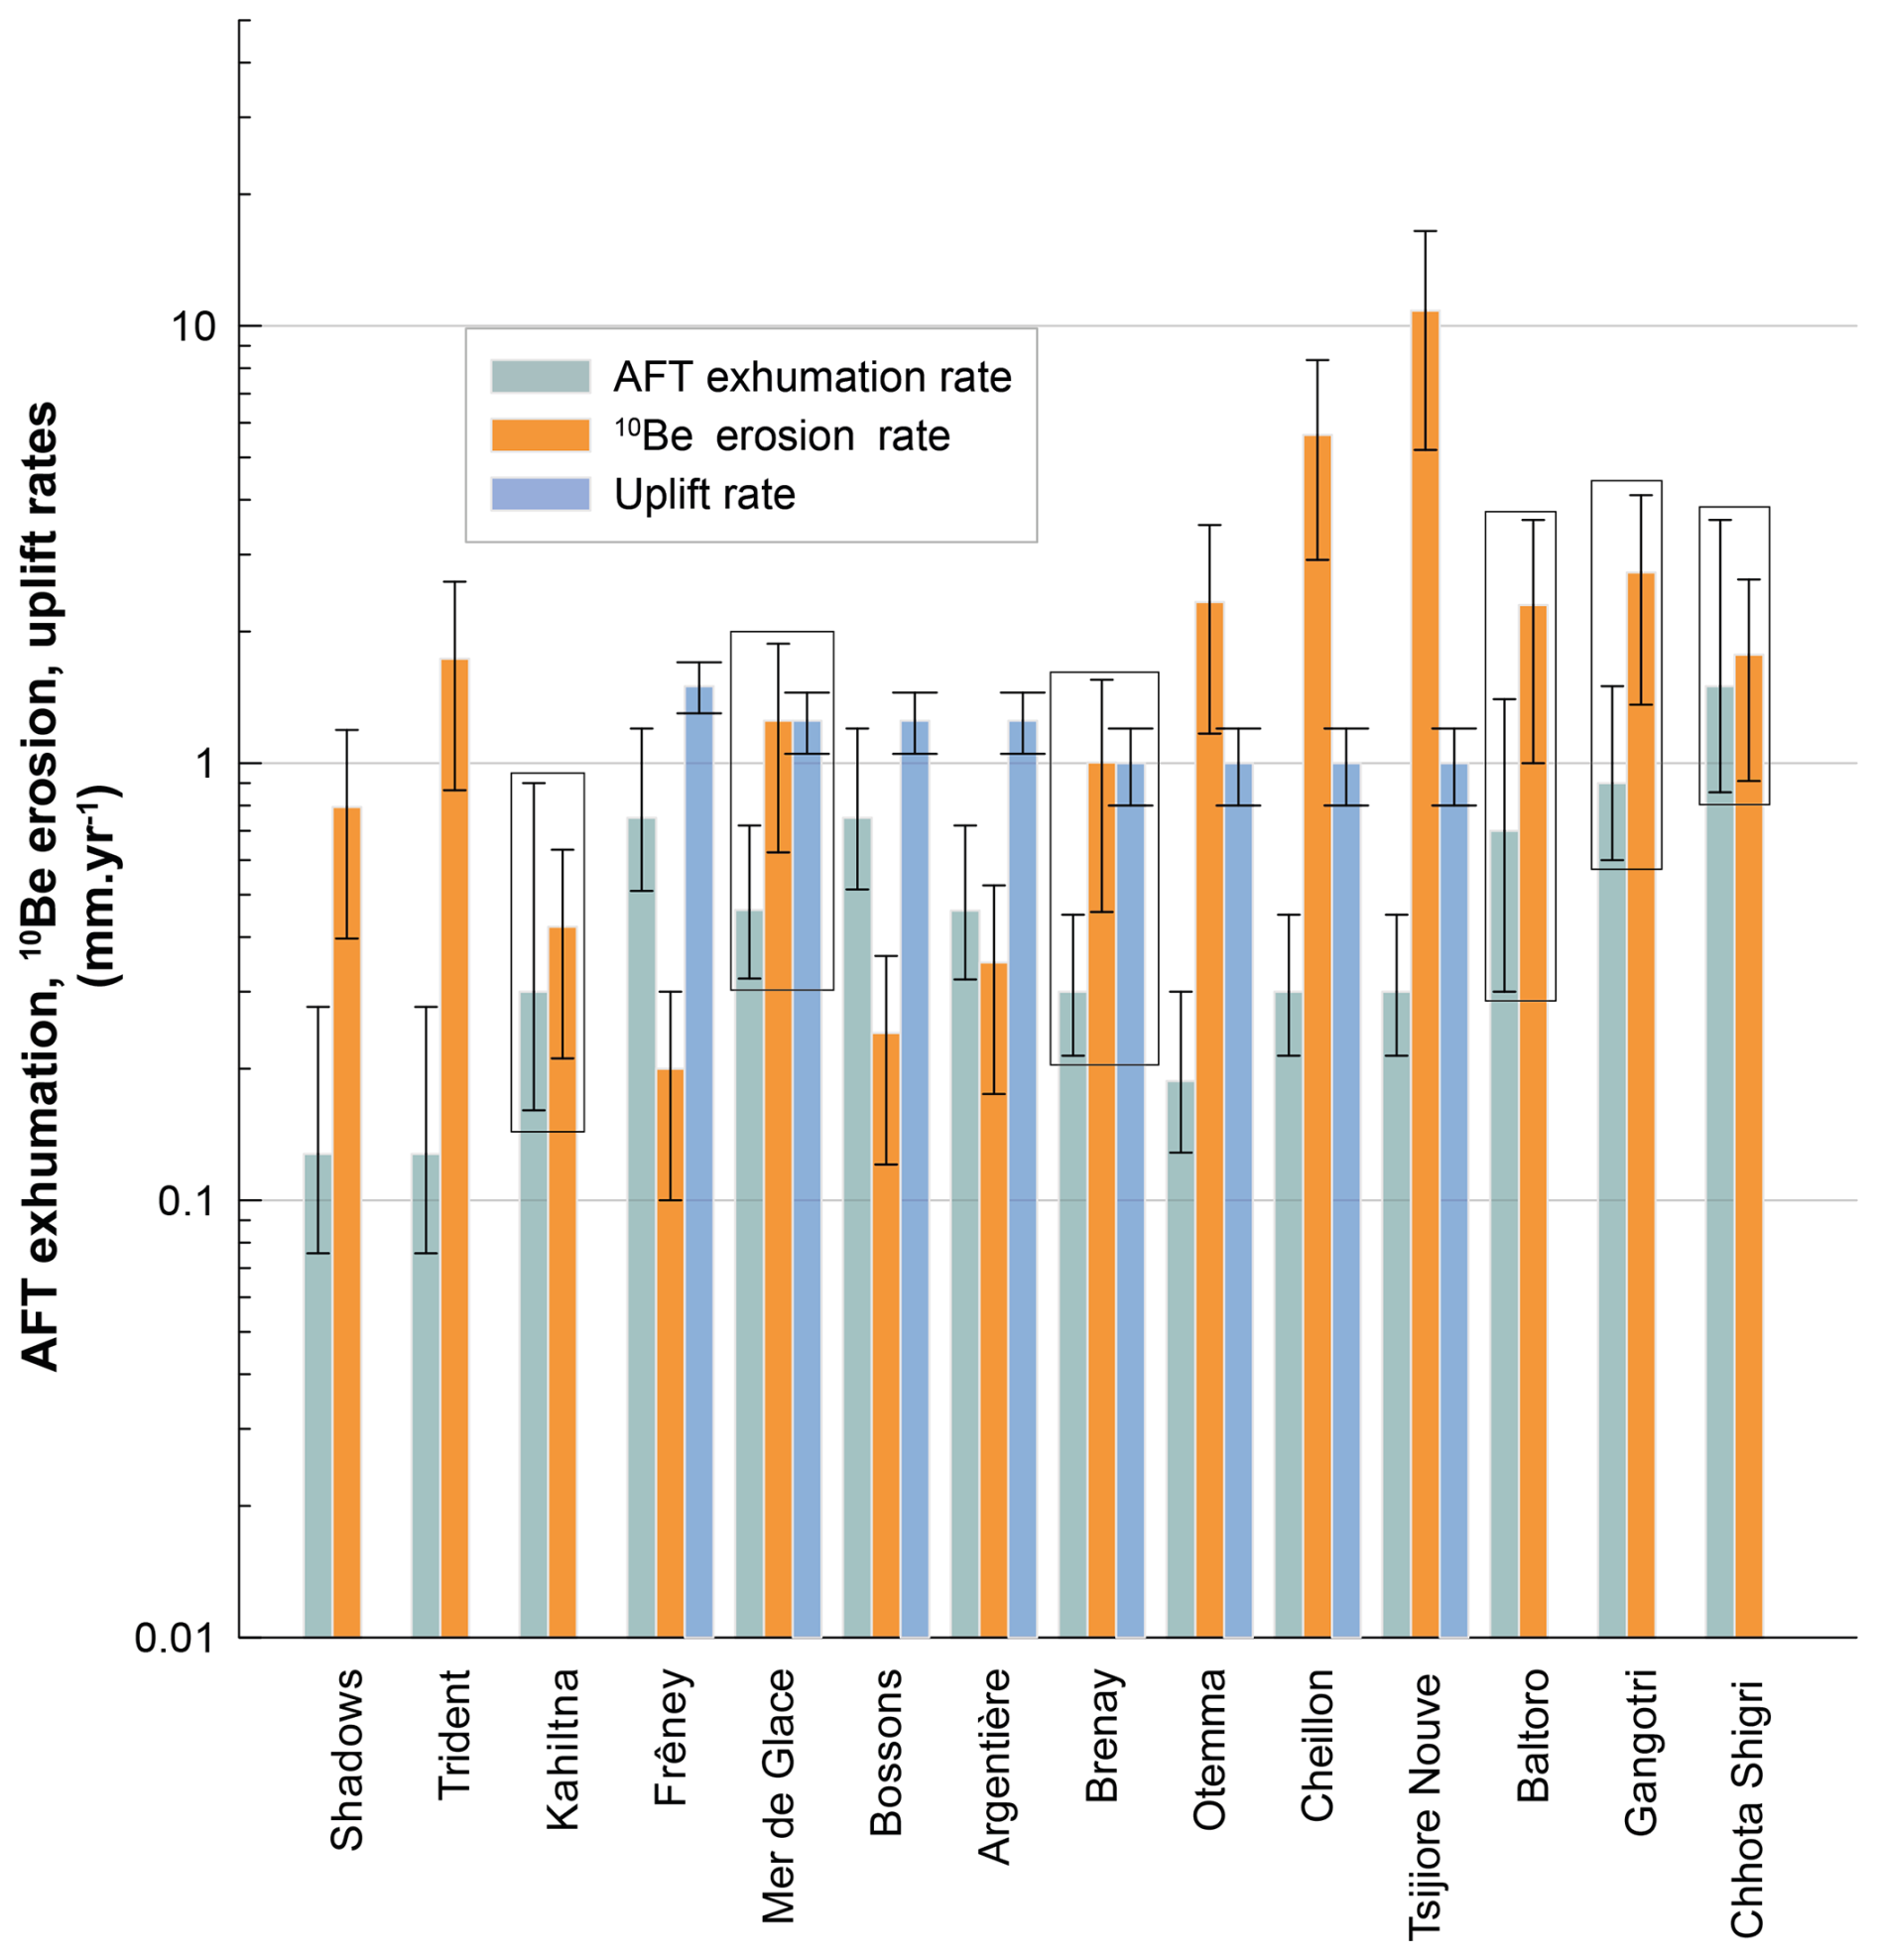
Figure 10Comparison of vertical change rates: exhumation rates from apatite fission track (AFT) data, uplift rates from geodetic measurements, and rockwall erosion rates derived from 10Be concentrations in supraglacial clasts. Rectangles: glaciers where the compared rates are of the same order of magnitude.
4.3 Drivers of rockwall erosion
The previously published studies have proposed different factors influencing rockwall erosion. For instance, the observed increase in supraglacial 10Be concentrations downstream on the Otemma glacier has been attributed to intensified erosion since the Little Ice Age (Wetterauer et al., 2022). Furthermore, the influence of the evolution of ice and snow cover (Krautblatter et al., 2013), nicely revealed by terrestrial laser scanning (Courtial-Manent et al., 2024a), would be captured by 10Be erosion rates: for the Petit Mont Collon rockwalls (Swiss Alps), ice-free areas have expanded by ∼150 % since the Little Ice Age, likely contributing to the observed increase in 10Be erosion rate (Wetterauer and Scherler, 2023). For the Chhota Shigri glacier (Himalaya), increasing 10Be concentrations downglacier may reflect intensified erosion of recently deglaciated sidewalls (Scherler and Egholm, 2020).
In contrast, Orr et al. (2021) suggest that tectonic uplift, rather than climate variation, is the primary control on rockwall erosion patterns, as evidenced at the scale of the Himalayas. In addition, geomorphological features such as rockwall elevation (Sarr et al., 2019), slope, and aspect (Wetterauer and Scherler, 2023) appear to influence erosion rates but are themselves simultaneously influenced by tectonics and climate (Burbank and Anderson, 2011).
Studies of 10Be concentrations in fluvial sediments similarly indicate a dichotomy between regions where erosion processes are controlled by tectonic activity (Wittmann et al., 2007) versus those driven by climatic fluctuations (Delunel et al., 2010). These insights from 10Be-derived fluvial erosion rates have been further corroborated through comparisons with climatic proxies (Hales and Roering, 2007) or other methods that estimate the vertical component of erosion (Sternai et al., 2019). Using this comparative framework, we assess the relative contributions of climate and geodynamic drivers, including tectonics, in shaping rockwall erosion.
4.3.1 Geodynamic drivers
All components of Earth's vertical motion, whether originating from plate tectonics or lithospheric thermally driven processes that are glacially or erosionally driven rebound, are grouped here as “geodynamics drivers” (Van Zelst et al., 2022). The influence of geodynamic drivers is evaluated through comparisons of 10Be-derived erosion rates with methods that quantify either the absolute motions of rock masses (uplift rate, in a Lagrangian-type description) or their approach towards Earth's surface (exhumation rate, in an Eulerian-type description).
Spatial geodesy has facilitated the estimation of uplift rates over the past few decades, although data coverage remains uneven. In the European Alps, several studies have provided estimates of present-day uplift rates (Nocquet et al., 2016; Sternai et al., 2019). These geodetically measured uplift rates are approximately double the exhumation rates obtained from apatite fission track (AFT) data (Nocquet et al., 2016). In regions like the Himalayas and Alaska, where geodetic uplift data are sparse, we compare 10Be erosion rates with AFT-derived exhumation rates.
AFT analysis is a well-established method for estimating exhumation rates over timescales of 105–107 years (Kohn et al., 2024) and has been applied globally. AFT cooling ages have been compiled for the sites of 10Be studies, from direct measurements in Alaska (Fitzgerald et al., 1995; Benowitz et al., 2011) and the Himalayas (Searle et al., 1999; Kořínková et al., 2014; Eugster et al., 2018) through interpolation for the European Alps (Vernon et al., 2008). Long-term exhumation rates are derived from AFT cooling ages, assuming an AFT system's closure temperature of 60–110 °C and a geothermal gradient of 25–35 °C km−1 (Deeken et al., 2011), which provides estimates of very long term (∼106 years) erosion rate.
AFT exhumation rates are generally comparable (and compatible, given uncertainties) to 10Be-derived rockwall erosion rates across various study sites (Fig. 10), including Himalayan glaciers (Gangotri, Chhota Shigri, Baltoro), Alpine glaciers (Argentière, Mer de Glace, and Brenay), and the Kahiltna Glacier in Alaska. However, rockwall erosion rates are lower than exhumation rates for the Bossons and Frêney glaciers (Western Alps) and exceed exhumation rates for two Alaskan glaciers (Shadows and Trident) as well as for three Swiss glaciers (Otemma, Cheillon, and Tsijiore Nouve).
In the Alps, the measured uplift rates align with 10Be-derived erosion rates for the Mer de Glace (Western Alps) and Brenay (Swiss Alps). However, 10Be erosion rates are lower for three glaciers in the Western Alps (Bossons, Argentière, and Frêney) and exceed uplift rates for three glaciers in the Swiss Alps (Otemma, Cheillon, and Tsijiore Nouve).
The coherence across timescales – ∼10 years (geodesy), ∼104 years (10Be), and ∼106 years (AFT) – suggests a relatively stable driver, as expected from geodynamic processes. This geodynamic influence is particularly evident in the Himalayas, where high exhumation rates ( mm yr−1) are observed. This coherence is also observed in large glacier catchments, suggesting that their size may buffer spatial and temporal fluctuations in erosion rates, providing an averaged signal of rockwall erosion.
4.3.2 Climatic and morphologic drivers
For the glaciers where 10Be and AFT results differ significantly, it is suggested that climatic drivers override geodynamic drivers of erosion, at least on the timescale represented by 10Be measurements. Five of the seven glaciers in this case are located in the European Alps, providing a strong basis for analyzing the influence of climatic drivers on recent erosion rates when compared to studies of thermal conditions in rockwalls (e.g., Boeckli et al., 2012a).
In the European Alps, high-altitude catchments (up to 4800 m a.s.l.) with steep average slopes exceeding 55°, such as the Bossons and Frêney glaciers (Western Alps), exhibit 10Be erosion rates 3 times lower than exhumation rates and more than 5 times lower than the uplift rate (Fig. 10). These reduced rates may result from persistently low temperatures, where even summer conditions fail to induce daily thawing, maintaining deep permafrost in most rockwalls (Fischer et al., 2012; Magnin et al., 2023).
Conversely, for glacial catchments with lower-elevation areas, rockwall erosion rates are significantly higher. For example, the Tsijiore Nouve rockwalls (Swiss Alps, mean altitude ∼3300 m a.s.l.) exhibit erosion rates of 11 mm yr−1 (Wetterauer and Scherler, 2023), i.e., 35 times greater than the exhumation rate (Fig. 10).
High erosion rates have been observed at elevations below 4800 m a.s.l. (Fischer et al., 2012; Ravanel and Deline, 2013; Courtial-Manent et al., 2024a). At these altitudes, frequent freeze–thaw cycles within the active layer of permafrost drive numerous rockfalls. For these relatively low-lying catchments, both slope and aspect have also been shown to significantly influence rockwall erosion rates (Wetterauer and Scherler, 2023).
Thermal conditions at the rock surface strongly influence erosion rates and are primarily controlled by elevation, slope, aspect, and cumulative solar insolation (Gruber, 2012; Boeckli et al., 2012a). These factors are integrated into the MARST model (mean annual rock surface temperature), which provides a spatially distributed estimate of surface thermal regimes (Boeckli et al., 2012b). Although MARST serves as a useful proxy for assessing rockwall stability, its absolute values can be affected by factors such as the DEM resolution (Magnin et al., 2017), introducing biases and reinforcing its role as a primarily qualitative tool. In this study, MARST has been calculated uniformly across the Western and Swiss Alps, following the methodology of Boeckli et al. (2012b), which incorporates climatic data from 1961–1990 (Table S2) and the same DEM input.
The correlation between erosion rates and topographic or thermal parameters was analyzed to evaluate their respective influences (Table 2; Fig. 11). A significant statistical correlation was observed only between erosion rate and the mean elevation of rockwalls (Fig. 11a), with a Spearman correlation coefficient (Hauke and Kossowski, 2011) of 0.7. Notably, the sharp increase in erosion rates below a mean elevation of approximately 3300 m a.s.l. suggests a power law relationship (Fig. 11a). This preliminary result aligns with other studies that identify frost cracking as a major driver of erosion (e.g., Delunel et al., 2010), supporting the hypothesis that frost cracking is elevation-dependent. For mean MARST (Fig. 11b) and slope (Fig. 11c), statistical correlations are weak, with Spearman correlation coefficients of less than 0.24. Visual inspection nonetheless suggests nonlinear relationships: with a maximum erosion rate at a slope of around 45° (Fig. 11c) and a MARST of approximately −1.75 °C (Fig. 11B). These findings are consistent with previous research: permafrost degradation is likely increased within a MARST range of −2 to −4 °C (e.g., Gruber and Haeberli, 2007; Legay et al., 2021), and erosion depends on slope (e.g., Culling, 1960) and is limited by thresholds (DiBiase et al., 2023).
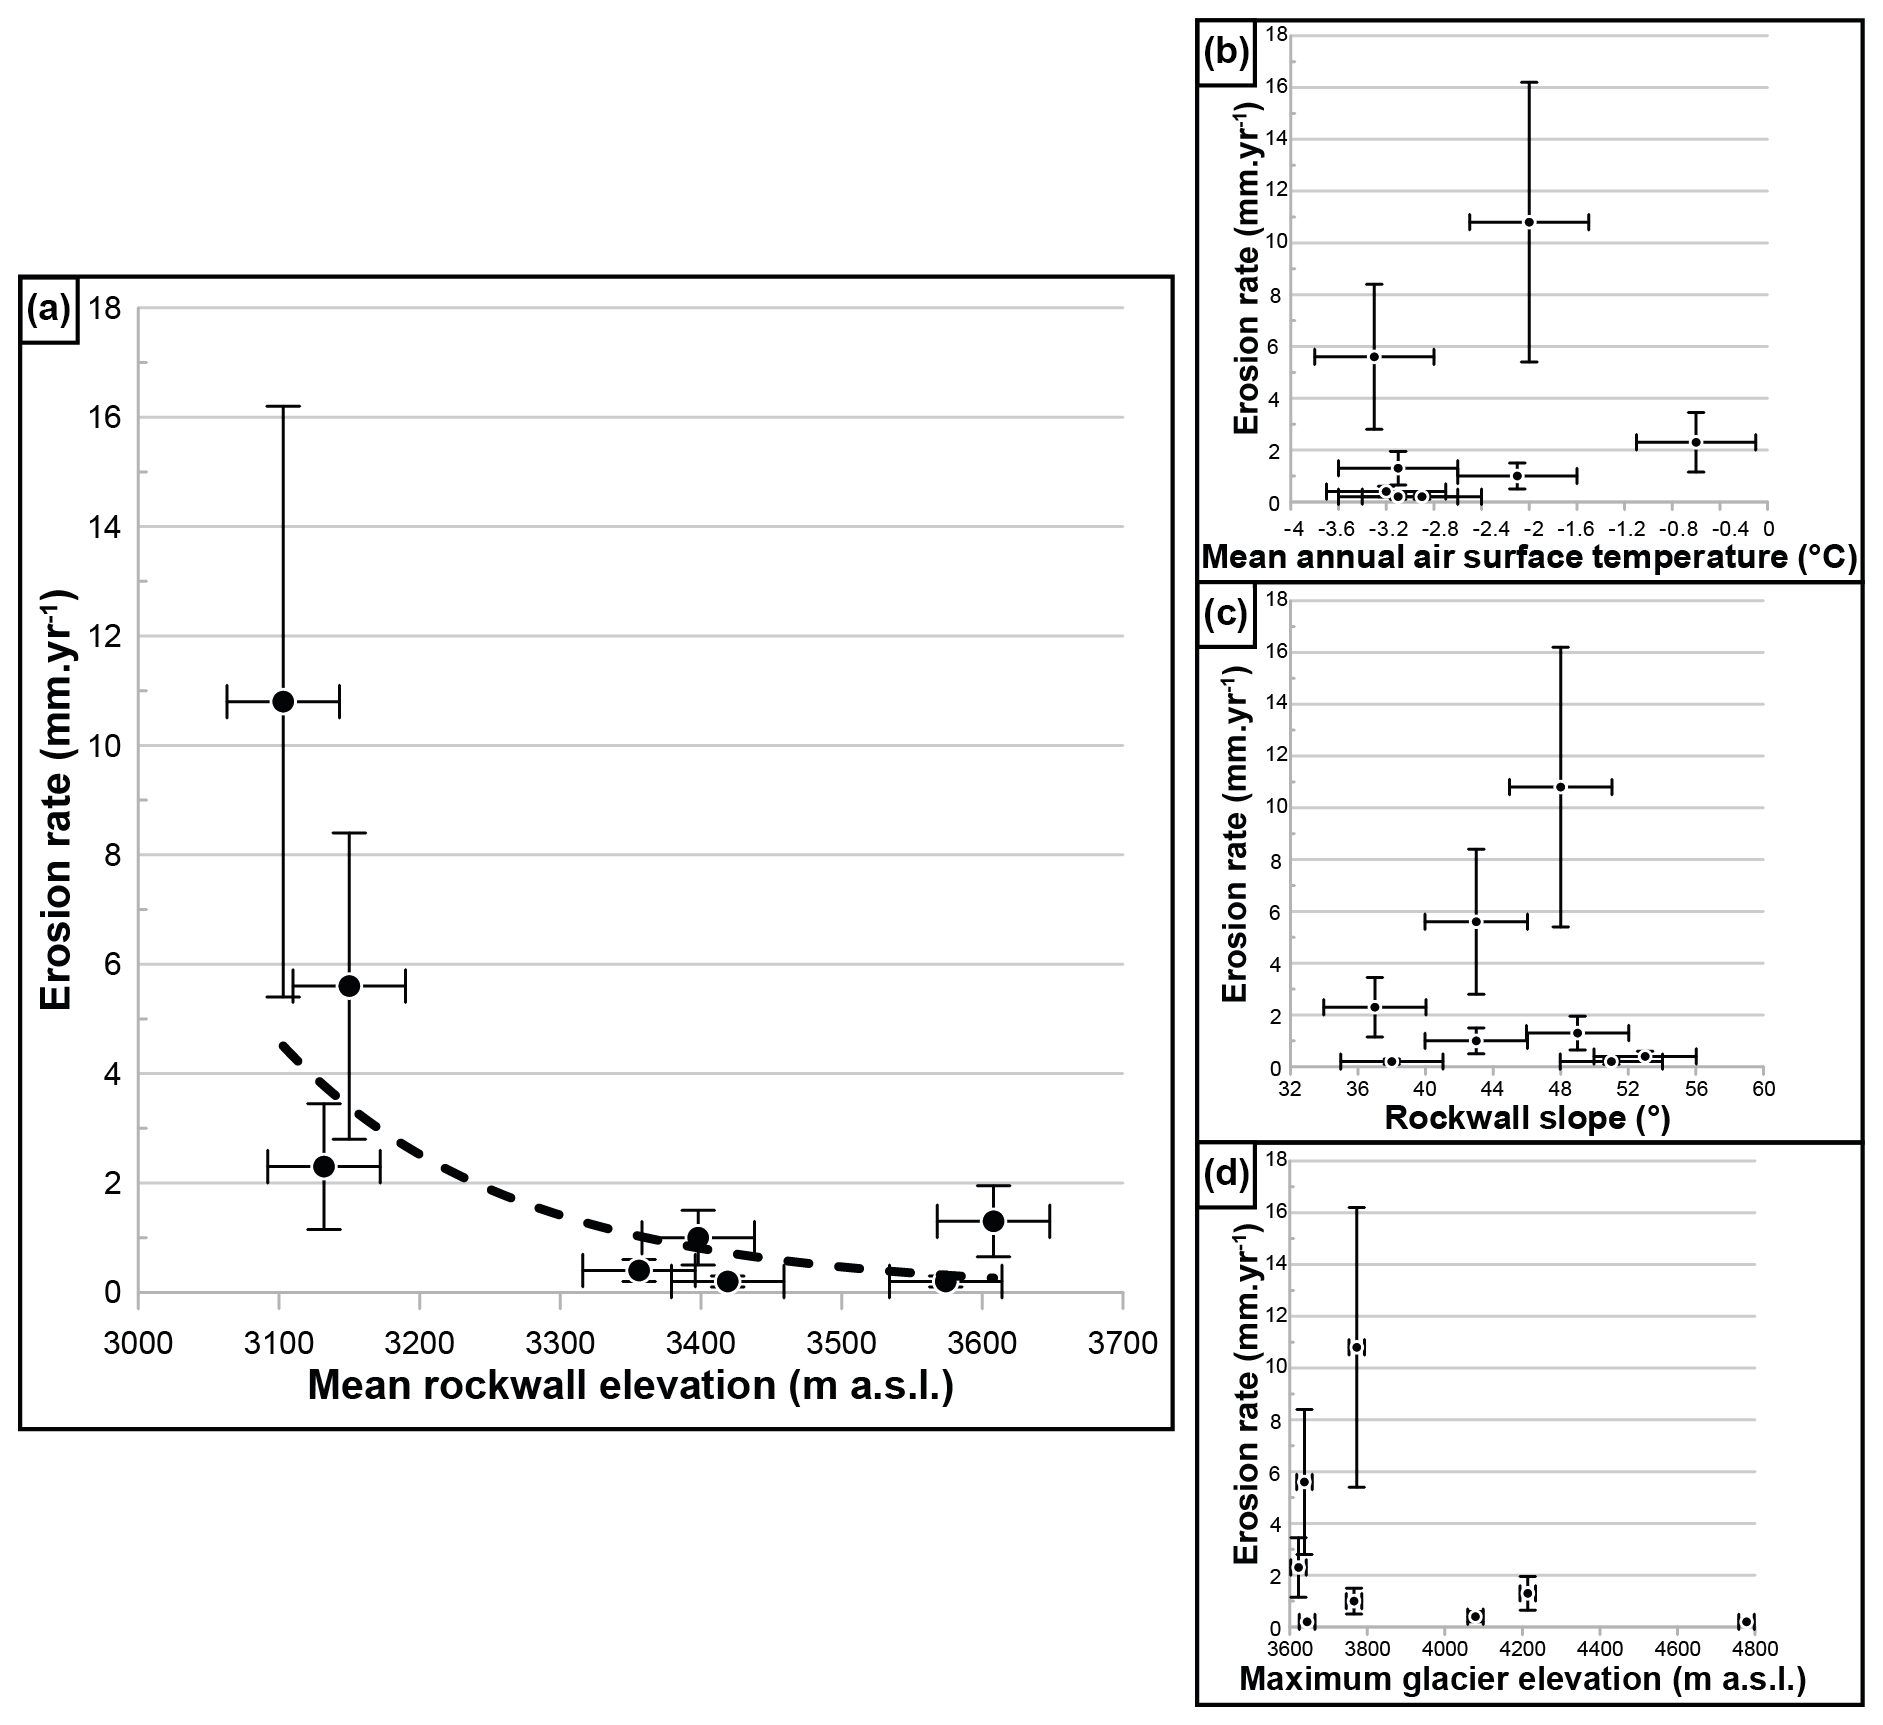
Figure 11Influence of (a) slope, (b) MARST, (c) mean rockwall elevation, and (d) maximum glacier elevation on the 10Be rockwall erosion rate in the European Alps.
Table 2Thermal and topographic characteristics of the European Alps glaciers where more than five supraglacial samples were analyzed.
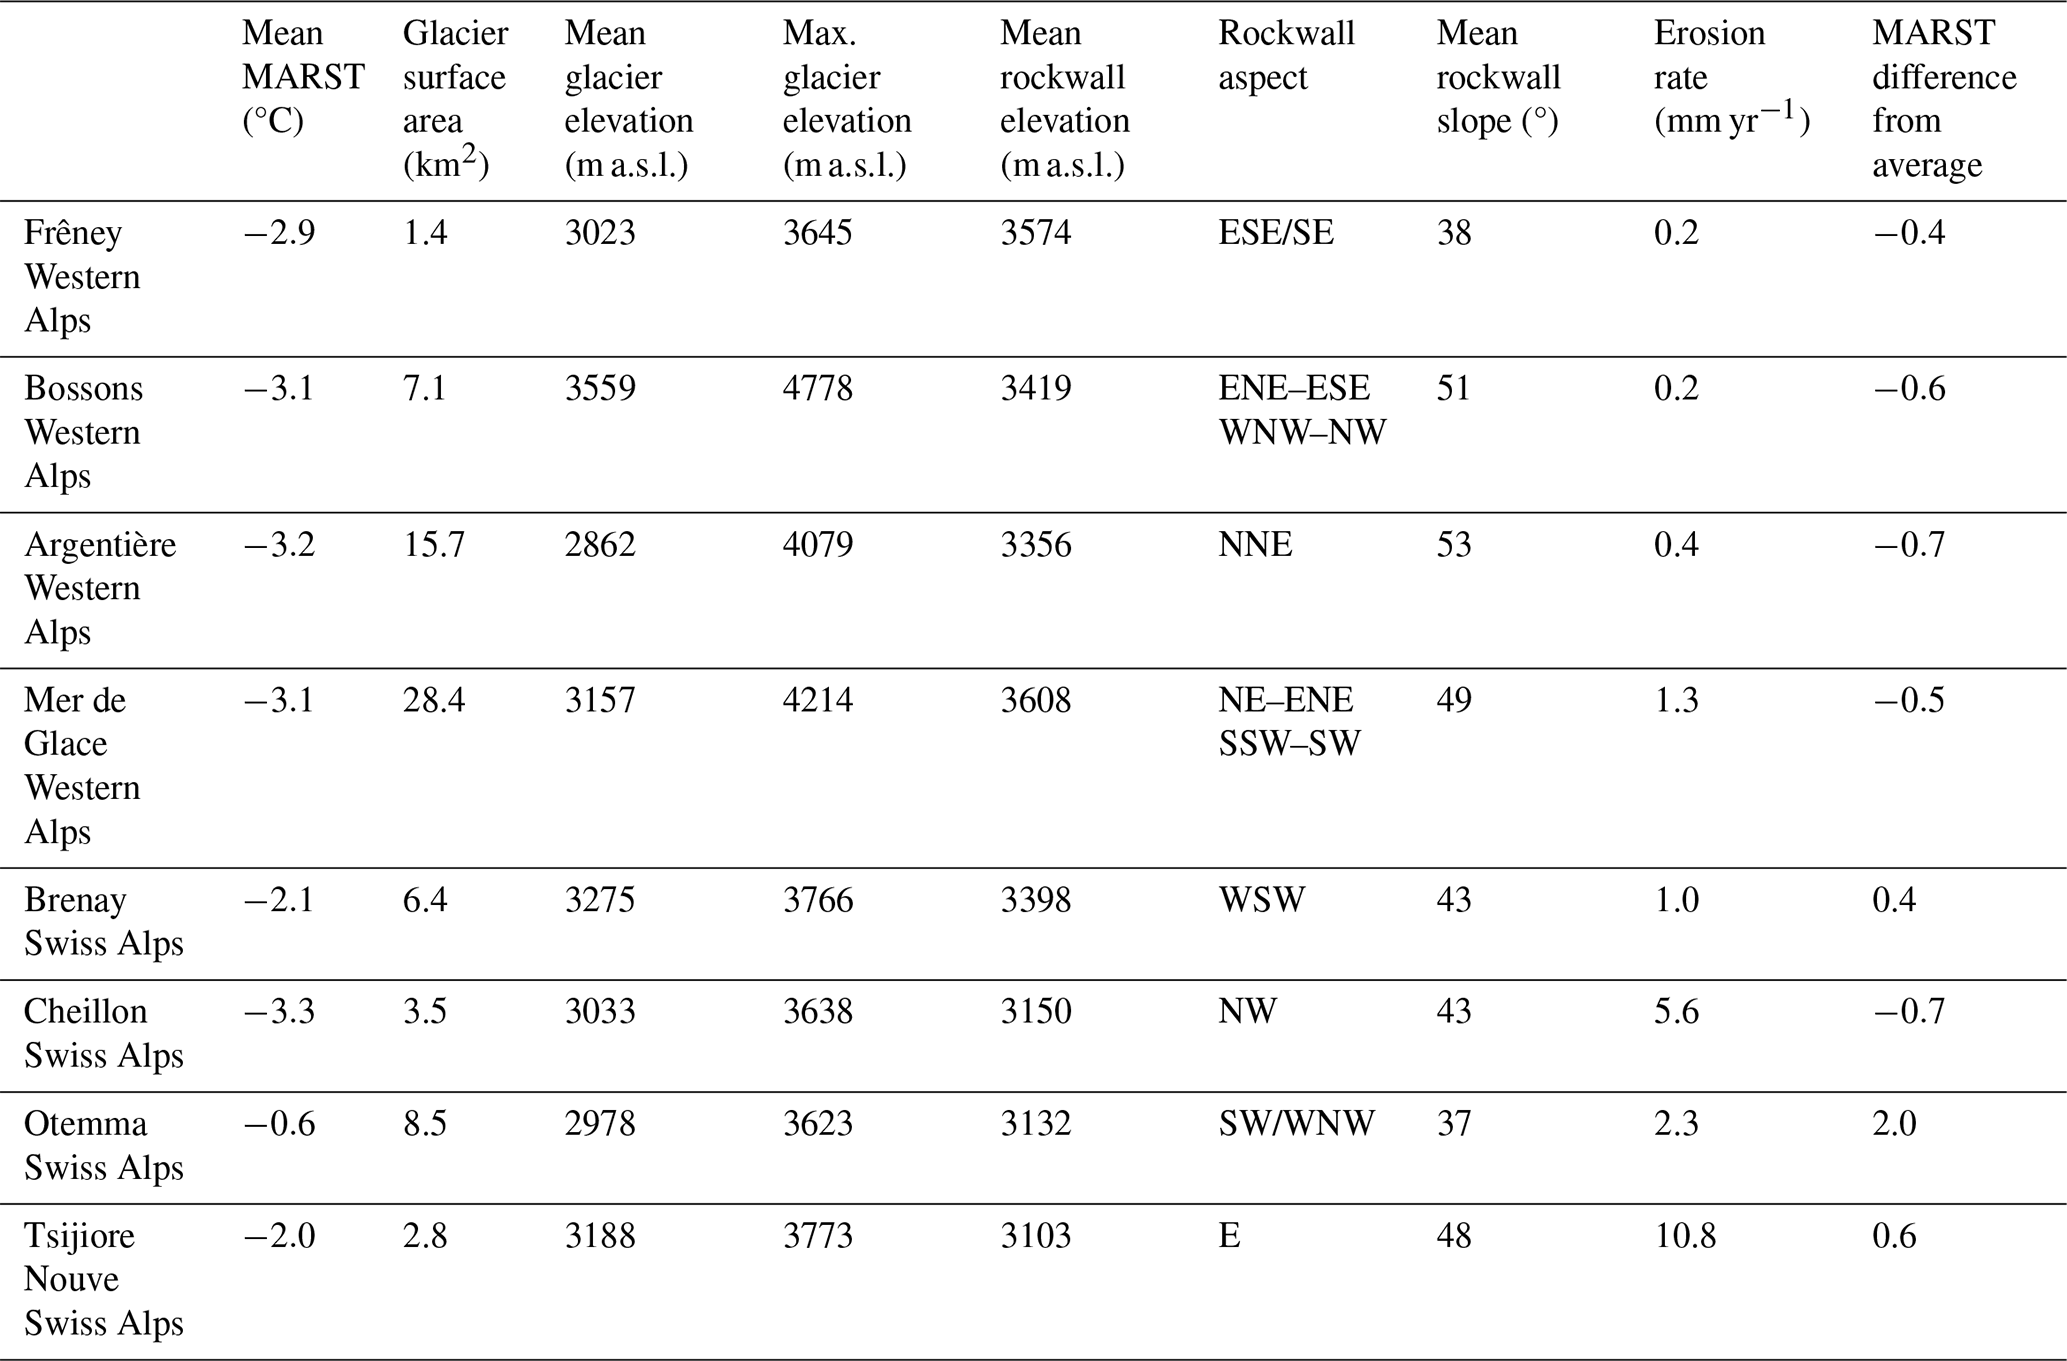
These preliminary results highlight the complex interplay of climatic and topographic controls over 10Be erosion rates. Models like MARST, which integrate elevation, solar radiation, and air temperature, remain insufficient to fully explain variations in erosion rates. Progress requires incorporating long-term records of thermal and precipitation evolution, as well as the dynamics of ice and snow cover. Nonetheless, the elevation and slope angle of glacier catchments qualitatively emerge as important topographic controls. Overall, these studies illustrate that rockwall erosion rates are modulated by climatic fluctuations superimposed on a background of tectonic uplift.
5.1 Presentation of the results
To address the challenges encountered in the preceding analyses, standardization in data collection, presentation, and analysis is critical. Detailed documentation of field sampling campaigns should be provided, including metadata such as geographic coordinates (latitude, longitude, and altitude), the fraction of material collected, and the surface area of the sampling zone. This documentation should be complemented by photographs of the sampling site, encompassing both the sampled zones and their surrounding rockwalls or source areas.
Accurate mapping of the inferred source zones is also essential. These maps should include the assumptions used to determine clast paths, such as fall zones on the glacier, clast trajectories, and glacier velocities. Wherever possible, such data should be made accessible through GIS files to facilitate simultaneous visualization with satellite imagery and other maps that quantitatively describe the local morphology.
The presentation of 10Be results should follow established norms for chemical procedures, as outlined by Dunai (2010), with 104 at g−1 and mm yr−1 serving as the recommended units for 10Be concentrations and erosion rates, respectively. Erosion rates must also specify the orientation of the erosion vector. The vertical component provides ease of comparison with other studies, such as 10Be erosion rates at the river catchment scale, AFT studies, or alternative methods. For steep and small-scale rockwalls, where retreat rates are often preferred (e.g., Wetterauer and Scherler, 2023), it is crucial to clearly indicate the mean slope and orientation of the rockwall.
To ensure robust estimates of 10Be production during supraglacial transport, glacier velocity data (Millan et al., 2022) and ELA estimates (Davaze et al., 2020) are now available, either globally or for the European Alps only, and can be integrated into simple models such as those proposed by Wetterauer and Scherler (2023) or Courtial-Manent et al. (2025). It is also important to account for the temporal context of the erosion rate estimates, considering both the time required to erode the 10Be attenuation length (∼60 cm) and the duration of glacial transport.
The robustness of erosion rate estimates should be assessed by statistically evaluating the number of rockfalls amalgamated in the supraglacial samples. Uncertainty estimates for the erosion rates should include not only analytical uncertainties but also those arising from source zone altitude distributions, snow cover, shielding calculations, and assumptions of continuous erosion for stochastic rockfall events. A more systematic approach to addressing these uncertainties would greatly enhance the comparability and reliability of future studies.
5.2 Challenges and opportunities
The use of the 10Be method to supraglacial deposits implies a detailed understanding of the origin and transport pathways of clasts, which requires increasingly quantitative approaches. Addressing this challenge will depend on the development of interdisciplinary transport models that combine insights from rockfall mechanics, glaciology, and the dynamics of supraglacial load movement. This represents a significant but promising area of research.
The study of rockfalls requires detailed inventory work, as well as the creation of advanced statistical tools, to analyze their spatial and temporal distributions. Existing methods, such as those by Hantz et al. (2021) or Courtial-Manent et al. (2025), provide useful frameworks but require refinement and broader application. Robust rockfall databases will allow for the calibration of models estimating the extent of rockfall deposits on glaciers.
Avalanches and crevasses, especially those near rockwall bases, contribute to the temporary storage of clasts and require further research (Ravanel et al., 2023). Additionally, the lateral spread of supraglacial material caused by uneven ice movement (Kirkbride and Deline, 2013) remains a complex modeling challenge, especially considering its impact on debris dispersal.
In the realm of glacier modeling, advanced systems like Elmer/Ice, which apply full-Stokes flow models (https://elmerice.elmerfem.org/, last access: August 2025), can simulate complex glacier dynamics. Alternative models, such as the Open Global Glacier Model (OGGM, https://oggm.org/, last access: August 2025) and the Instructed Glacier Model (IGM, https://github.com/instructed-glacier-model/igm, last access: August 2025), can also be used for broad-scale projections. However, their application is hampered by uncertainties in basal topography and disequilibrium mass balances (Löfgren et al., 2024). Promising approaches include inverse modeling procedures to deduce ice flow geometries from observed kinematics (Jouvet and Cordonnier, 2023). Such methods will provide valuable tools for calculating clast trajectories and estimating 10Be production during supraglacial transport (Wetterauer and Scherler, 2023).
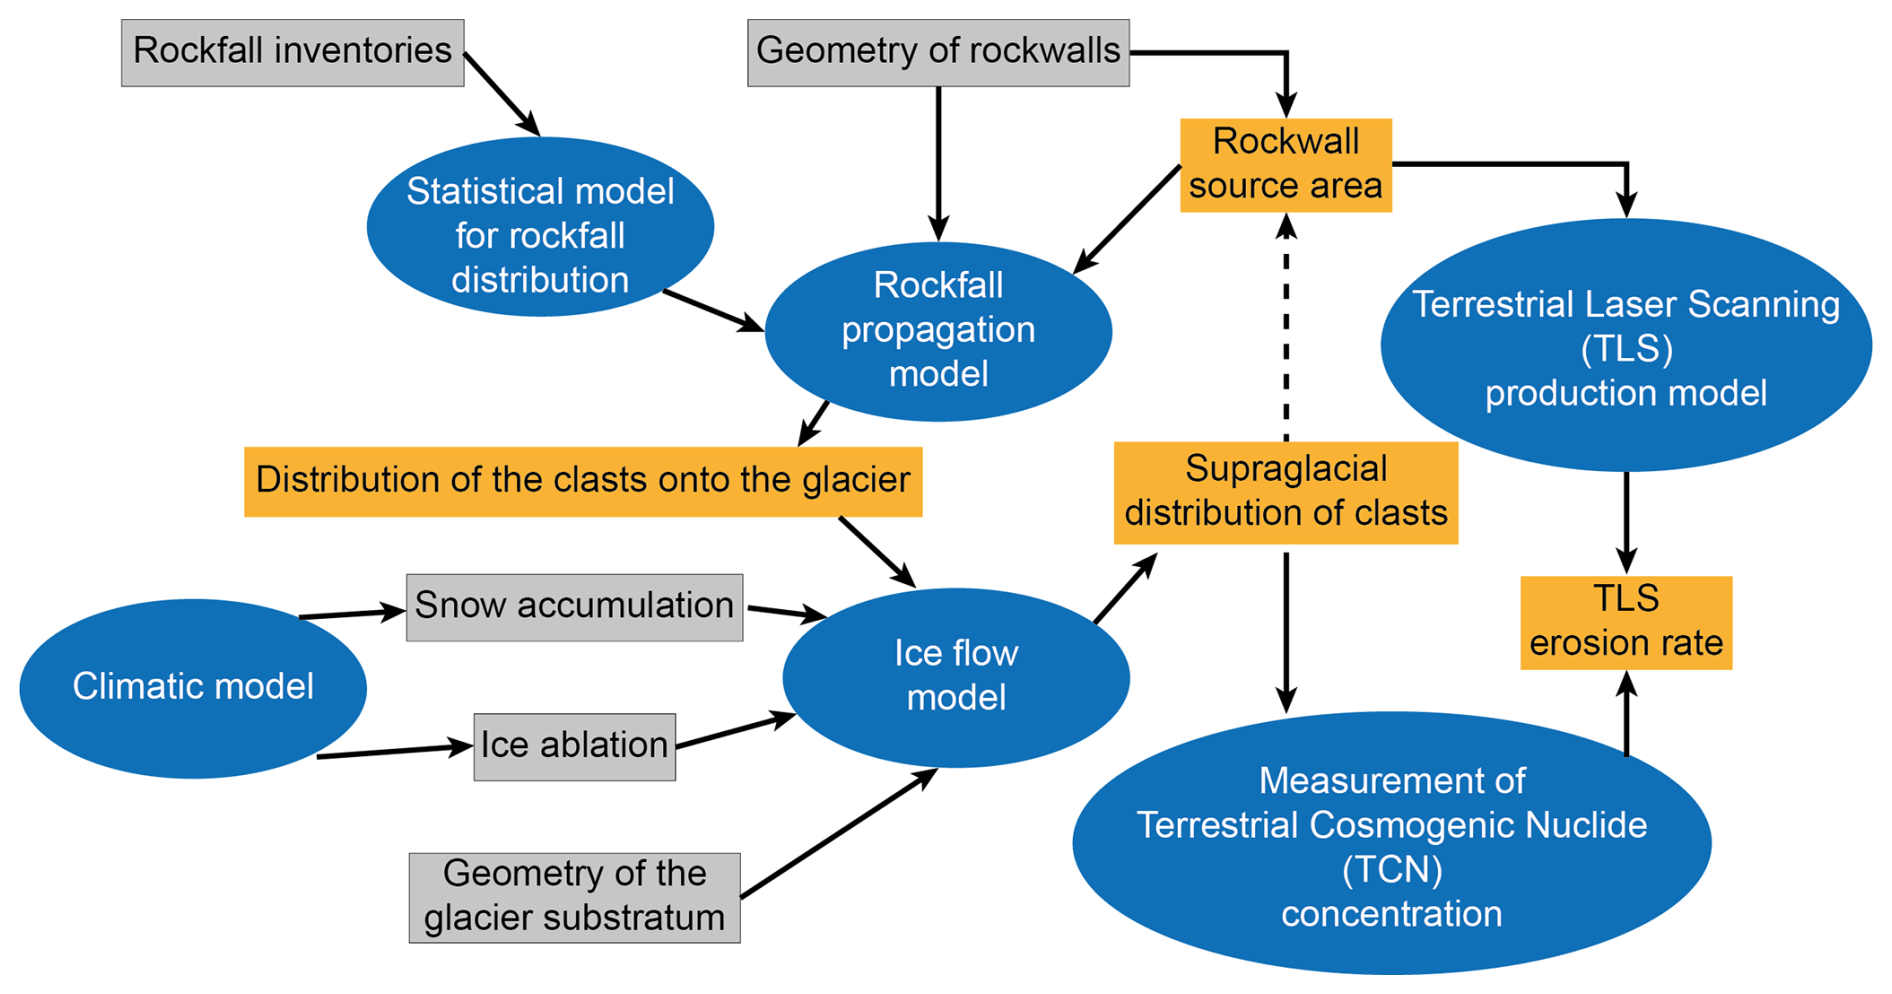
The temporal evolution of rockwall erosion rates could benefit from multi-isotope approaches. Pairing isotopes with distinct half-lives and attenuation lengths, such as 14C and 10Be, is particularly promising (Goehring et al., 2013). Complementary studies are needed to explore the stochastic nature of rockfalls and their influence on 10Be concentrations. A combination of the theoretical approach of Ward and Anderson (2011) with the analysis of real rockfall catalogs seems promising (Courtial-Manent et al., 2025). Additionally, while both topographic shielding and oblique radiation impact 10Be production on steep rockwalls, user-friendly software that accounts for their combined and opposing effects is currently lacking (DiBiase, 2018). These challenges highlight the need for an integrated computational procedure (Fig. 12) that simulates the entire supraglacial transport system, incorporating variability in glacier geometry, source zones, and debris pathways based on on-site data. While recent work by Jouvet and Cordonnier (2023) illustrates how artificial intelligence (AI) can accelerate glacier modeling by pre-solving complex equations, the broader potential of AI in this context remains largely untapped. Specifically, AI techniques could be leveraged for tasks such as identifying clast origins, reconstructing transport trajectories, analyzing remote sensing imagery, or integrating large heterogeneous datasets. Such applications would enhance trajectory modeling and enable erosion rate estimates for individual rockwall sections. Ultimately, these advances would also illuminate the feedback between glacier dynamics and supraglacial debris transport, thereby refining our understanding of landscape evolution under changing climatic conditions (Scherler et al., 2011; Rowan et al., 2015).
Estimating rockwall erosion rates from supraglacial 10Be is an original and promising approach, although significant advances are necessary to address its current limitations. Unlike river catchments, for which average erosion rates are also inferred from 10Be, the dynamics of glacial systems and their associated rockwalls present unique challenges, in particular the following:
-
The portion of the basin covered and eroded by the glacier is not accounted for in this approach, leaving a component of the erosion system unquantified.
-
The dynamics of clast mixing during glacial transport differ from fluvial transport as glacial mixing is far less efficient and does not induce the grain-size segregation observed in rivers.
-
A detailed understanding of the trajectory of supraglacial load is essential to accurately locate clast origins, thereby enabling erosion rate estimates specific to individual rockwall sections.
Future progress in this field will depend on the development of numerical tools capable of modeling the clast transport system in greater detail. Such tools would improve the systematic determination of clast origin and enhance both the robustness and the accuracy of the methodology. Realistic glacier dynamic models incorporating rheological complexity must be coupled with, likely statistical, models of rockfall propagation. The incorporation of key boundary conditions, such as basal glacier geometry, and the temporal evolution of snow accumulation and ablation, will be essential for refining these models. Testing the influence of these boundary conditions would further enhance understanding of their role in erosion processes.
At this stage, the spatial and temporal resolution of the 10Be supraglacial method remains limited. To address this, we proposed good practices. In particular, we judge essential to sample supraglacial debris across extensive areas and perform multiple measurements on the same glacier. This would allow for averaging the significant spatial and temporal variability inherent in rockwall erosion rates. Standardizing sampling protocols and systematically reporting metadata are foundational steps to harmonize calculated erosion rates, enabling meaningful comparisons and fostering their integration into broader studies.
A distinctive advantage of the 10Be method applied to supraglacial clasts lies in its ability to estimate erosion rates over a timescale of approximately 1000 years, focusing on the most upstream sections of catchments. This temporal window is particularly valuable when comparing 10Be-derived erosion rates with those obtained using other methods, such as rockfall catalogs, which provide shorter-term insights, or low-temperature thermochronology, which captures rates over geological timescales. Such cross-comparisons hold great promise for advancing our understanding of the interplay between glacial dynamics, rockwall erosion, and long-term landscape evolution.
All of the underlying research data used in this study are available in Table S1 in the Supplement.
The supplement related to this article is available online at https://doi.org/10.5194/gh-80-339-2025-supplement.
All authors contributed to the study conception and design. LCM: data collection and analysis, writing (original draft and revised manuscript). JLM: conceptualization, data collection and analysis, writing (review and editing), funding acquisition, project administration. ACS: data collection and analysis, writing (review). LR: writing (review), funding acquisition. JC: data analysis, writing (review). RV: data analysis, writing (review). AS: data collection and analysis, writing (review).
The contact author has declared that none of the authors has any competing interests.
Publisher’s note: Copernicus Publications remains neutral with regard to jurisdictional claims made in the text, published maps, institutional affiliations, or any other geographical representation in this paper. While Copernicus Publications makes every effort to include appropriate place names, the final responsibility lies with the authors. Views expressed in the text are those of the authors and do not necessarily reflect the views of the publisher.
The ASTER team is warmly thanked for the cosmogenic nuclide analyses performed at the ASTER AMS facility (CEREGE, Aix-en-Provence). We thank the editor and the reviewers for their valuable feedback, which helped improve this paper. Léa Courtial-Manent's thesis was funded by grants from Labex OSUG (Grenoble Observatory) and USMB (Université Savoie-Mont-Blanc). This work contributes to the INSU Tellus project (MORCLIM-YDNG; 2024).
This research has been supported by the Université Savoie Mont Blanc (grant no. USMB) and Labex OSUG (Grenoble Observatory).
This paper was edited by Martin Hoelzle and reviewed by two anonymous referees.
Allen, P.: From landscapes into geological history, Nature, 451, 274–276, https://doi.org/10.1038/nature06586, 2008.
Anderson, R. S.: A model of ablation-dominated medial moraines and the generation of debris-mantled glacier snouts, J. Glaciol., 46, 459–469, https://doi.org/10.3189/172756500781833025, 2000.
Anderson, R. S., Anderson, L. S., Armstrong, W. H., Rossi, M. W., and Crump, S. E.: Glaciation of alpine valleys: The glacier–debris-covered glacier–rock glacier continuum, Geomorphology, 311, 127–142, 2018.
Andersen, J. L., Egholm, D. L., Knudsen, M. F., Jansen, J. D., and Nielsen, S. B.: The periglacial engine of mountain erosion – Part 1: Rates of frost cracking and frost creep, Earth Surf. Dynam., 3, 447–462, https://doi.org/10.5194/esurf-3-447-2015, 2015.
Balco, G., Stone, J. O., Lifton, N. A., and Dunai, T. J.: A complete and easily accessible means of calculating surface exposure ages or erosion rates from 10Be and 26Al measurements, Quatern. Geochronol., 3, 174–195, https://doi.org/10.1016/j.quageo.2007.12.001, 2008.
Beaumont, C., Fullsack, P., and Hamilton, J.: Erosional control on active orogens, in: Thrust Tectonics, 1, edited by: McClay, K. R., 18, Springer, Dordrecht, https://doi.org/10.1007/978-94-011-3066-0, 1992.
Beel, C. R., Lifton, N. A., Briner, J. P., and Goehring, B. M.: Quaternary evolution and ice sheet history of contrasting landscapes in Uummannaq and Sukkertoppen, western Greenland, Quaternary Sci. Rev., 149, 248–258, https://doi.org/10.1016/j.quascirev.2016.05.033, 2016.
Benn, D. I. and Evans, D. J. A.: Glaciers & glaciation, in: 2nd Edn., Hodder education, London, https://doi.org/10.1111/j.1502-3885.2011.00212.x, 2010.
Benowitz, J. A., Layer, P. W., Armstrong, P., Perry, S. E., Haeussler, P. J., Fitzgerald, P. G., and VanLaningham, S.: Spatial variations in focused exhumation along a continental-scale strike-slip fault: The Denali fault of the eastern Alaska Range, Geosphere, 7, 455–467, https://doi.org/10.1130/GES00589.1, 2011.
Boeckli, L., Brenning, A., Gruber, S., and Noetzli, J.: A statistical approach to modelling permafrost distribution in the European Alps or similar mountain ranges, The Cryosphere, 6, 125–140, https://doi.org/10.5194/tc-6-125-2012, 2012a.
Boeckli, L., Brenning, A., Gruber, S., and Noetzli, J.: Permafrost distribution in the European Alps: calculation and evaluation of an index map and summary statistics, The Cryosphere, 6, 807–820, https://doi.org/10.5194/tc-6-807-2012, 2012b.
Borchers, B., Marrero, S., Balco, G., Caffee, M., Goehring, B., Lifton, N., Nishiizumi, K., Phillips, F., Schaefer, J., and Stone, J.: Geological calibration of spallation production rates in the CRONUS-Earth project, Quatern. Geochronol., 31, 188–198, https://doi.org/10.1016/j.quageo.2015.01.009, 2016.
Braucher, R., Colin, F., Brown, E. T., Bourlès, D. L., Bamba, O., Raisbeck, G. M., Yiou, F., and Koud, J. M.: African laterite dynamics using in situ-produced 10Be, Geochim. Cosmochim. Ac., 62, 1501–1507, https://doi.org/10.1016/S0016-7037(98)00085-4, 1998.
Braucher, R., Brown, E. T., Bourlès, D. L., and Colin, F.: In situ-produced 10Be measurements at great depths: implications for production rates by fast muons, Earth Planet. Sc. Lett., 211, 251–258, https://doi.org/10.1016/S0012-821X(03)00205-X, 2003.
Burbank, D. and Anderson, R.: Tectonic Geomorphology. Wiley-Blackwell, p. 476, ISBN 978-0-632-04386-6, 2011.
Burbank, D. W., Leland, J., Fielding, E., Anderson, R. S., Brozovic, N., Reid, M. R., and Duncan, C.: Bedrock incision, rock uplift and threshold hillslopes in the northwestern Himalayas, Nature, 379, 505–510, https://doi.org/10.1038/379505a0, 1996.
Carretier, S., Regard, V., Vassallo, R., Aguilar, G., Martinod, J., Riquelme, R., Christophoul, F., Charrier, R., Gayer, E., Farías, M., Audin, L., and Lagane C.: Differences in 10Be concentrations between river sand, gravel and pebbles along the western side of the central Andes, Quatern. Geochronol., 27, 33–51, https://doi.org/10.1016/j.quageo.2014.12.002, 2015.
Cathala, M., Magnin, F., Ravanel, L., Dorren, L., Zuanon, N., Berger, F., Bourrier, F., and Deline, P.: Mapping release and propagation areas of permafrost-related rock slope failures in the French Alps: A new methodological approach at regional scale, Geomorphology, 448, 109032, https://doi.org/10.1016/j.geomorph.2023.109032, 2024.
Chmeleff, J., von Blanckenburg, F., Kossert, K., and Jakob, D.: Determination of the 10Be half-life by multicollector ICP-MS and liquid scintillation counting, Nucl. Instrum. Meth. Phys. Res. Sect. B, 268, 15192–15199, 2010.
Codilean, A. T.: Calculation of the cosmogenic nuclide production topographic shielding scaling factor for large areas using DEMs, Earth Surf. Proc. Land., 31, 785–794, https://doi.org/10.1002/esp.1336, 2006.
Coles, S.: An Introduction to Statistical Modeling of Extreme Values, in: Springer Series in Statistics, Springer, London. https://doi.org/10.1007/978-1-4471-3675-0, 2004.
Courtial-Manent, L., Ravanel, L., Mugnier, J.-L., Deline, P., Lhosmot, A., Rabatel, A., Duvillard, P.-A., and Batoux, P.: 18-years of high-Alpine rock wall monitoring using terrestrial laser scanning at the Tour Ronde east face, Mont-Blanc massif, Environ. Res. Lett., 19, 034037, https://doi.org/10.1088/1748-9326/ad281d, 2024a.
Courtial-Manent, L., Mugnier, J.-L., Ravanel, L., Carcaillet, J., Vassallo, R., Lhosmot, A., and Schwing, A.: Increased erosion rates on high-Alpine rockwalls evidenced by comparison of short-term (terrestrial LiDAR) and long-term (cosmogenic nuclides) approaches, in: EGU General Assembly 2024, Vienna, Austria, https://doi.org/10.5194/egusphere-egu24-17419, 2024b.
Courtial-Manent, L., Mugnier, J.-L., Ravanel, L., Carcaillet J., Deline, P., and Buoncristiani, J.-F.: A significant doubling of rockfall rates since the Little Ice Age in the Mont-Blanc massif, inferred from 10Be concentrations and rockfall inventories, Earth Planet. Sc. Lett., 651, 119142, https://doi.org/10.1016/j.epsl.2024.119142, 2025.
Culling, W. E. H.: Analytical theory of erosion, J. Geol., 68, 336–344, 1960.
Davaze, L., Rabatel, A., Dufour, A., Hugonnet, R., and Arnaud, Y.: Region-wide annual glacier surface mass balance for the European Alps from 2000 to 2016, Front. Earth Sci., https://doi.org/10.3389/feart.2020.00149, 2020.
Deeken, A., Thiede, R. C., Sobel, E. R., Hourigan, J. K., and Strecker, M. R.: Exhumational variability within the Himalaya of northwest India, Earth Planet. Sc. Lett., 305, 103–114, https://doi.org/10.1016/j.epsl.2011.02.045, 2011.
Deline, P., Gardent, M., Magnin, F., and Ravanel, L.: The morphodynamics of the mont blanc massif in a changing cryosphere: a comprehensive review, Geograf. Ann. A, 94, 265–283, https://doi.org/10.1111/j.1468-0459.2012.00467.x, 2012.
Deline, P., Akçar, N., Ivy-Ochs, S., and Kubik, P. W.: Repeated Holocene rock avalanches onto the Brenva Glacier, Mont Blanc massif, Italy: A chronology, Quaternary Sci. Rev., 126, 186–200, https://doi.org/10.1016/j.quascirev.2015.09.004, 2015.
Delunel, R., Van der Beek, P., Carcaillet, J., Bourlès, D., and Valla, P.: Frost-cracking control on catchment denudation rates: Insights from in situ-produced 10Be concentrations in stream sediments (Ecrins–Pelvoux massif, French Western Alps), Earth Planet. Sci. Lett., 293, 72–83, 2010.
Delunel, R., Schlunegger, F., Valla, P. G., Dixon, J., Glotzbach, C., Hippe, K., Kober, F., Molliex, S., Norton, K. P., Salcher, B., Wittmann, H., Akçar, N., and Christl, M.: Late-Pleistocene catchment-wide denudation patterns across the European Alps, Earth-Sci. Rev., 211, 103407, https://doi.org/10.1016/j.earscirev.2020.103407, 2020.
DiBiase, R. A.: Short communication: Increasing vertical attenuation length of cosmogenic nuclide production on steep slopes negates topographic shielding corrections for catchment erosion rates, Earth Surf. Dynam., 6, 923–931, https://doi.org/10.5194/esurf-6-923-2018, 2018.
DiBiase, R. A., Neely, A. B., Whipple, K. X., Heimsath, A. M., and Niemi, N. A.: Hillslope morphology drives variability of detrital 10Be erosion rates in steep landscapes, Geophys. Res. Lett., 50, e2023GL104392, https://doi.org/10.1029/2023GL104392, 2023.
Dunai, T. J.: Cosmogenic Nuclides: Principles, Concepts and Applications in the Earth Surface Sciences, Cambridge University Press, ISBN 978-0-521-87380-2, 2010.
Dunne, J., Elmore, D., and Muzikar, P.: Scaling factors for the rates of production of cosmogenic nuclides for geometric shielding and attenuation at depth on sloped surfaces, Geomorphology, 27, 3–11, https://doi.org/10.1016/S0169-555X(98)00086-5, 1999.
Dussauge, C., Grasso, J., and Helmstetter, A.: Statistical analysis of rockfall volume distributions: Implications for rockfall dynamics, J. Geophys. Res., 108, 2001JB000650, https://doi.org/10.1029/2001JB000650, 2003.
Eugster, P., Thiede, R. C., Scherler, D., Stübner, K., Sobel, E. R., and Strecker, M. R.: Segmentation of the Main Himalayan Thrust Revealed by Low-Temperature Thermochronometry in the Western Indian Himalaya, Tectonics, 37, 2710–2726, https://doi.org/10.1029/2017TC004752, 2018.
Farber, D., Mériaux, A., and Finkel, R.: Attenuation length for fast nucleon production of 10Be derived from near-surface production profiles Earth Planet. Sc. Lett., 274, 295–300, 2008.
Fischer, L., Purves, R. S., Huggel, C., Noetzli, J., and Haeberli, W.: On the influence of topographic, geological and cryospheric factors on rock avalanches and rockfalls in high-mountain areas, Nat. Hazards Earth Syst. Sci., 12, 241–254, https://doi.org/10.5194/nhess-12-241-2012, 2012.
Fitzgerald, P. G., Sorkhabi, R. B., Redfield, T. F., and Stump, E.: Uplift and denudation of the central Alaska Range: A case study in the use of apatite fission track thermochronology to determine absolute uplift parameters, J. Geophys. Res., 100, 20175–20191, https://doi.org/10.1029/95JB02150, 1995.
Gabet, E., Pratt-Sitaula, B., and Burbank, D.: Climatic controls on hillslope angle and relief in the Himalayas, Geology, 32; 629–632, https://doi.org/10.1130/G20641.1, 2004.
Gallach, X., Carcaillet, J., Ravanel, L., Deline, P., Ogier, C., Rossi, M., Malet, E., and Garcia-Sellés, D.: Climatic and structural controls on Late-glacial and Holocene rockfall occurrence in high-elevated rock walls of the Mont Blanc massif (Western Alps), Earth Surf. Process. Land., 45, 3071–3091, https://doi.org/10.1002/esp.4952, 2020.
Godon, C., Mugnier, J. L., Fallourd, R., Paquette, J. L., Pohl, A., and Buoncristiani, J. F.: The Bossons glacier protects Europe's summit from erosion, Earth Planet. Sc. Lett., 375, 135–147, https://doi.org/10.1016/j.epsl.2013.05.018, 2013.
Goehring, B. M., Muzikar, P., and Lifton, N. A.: An in situ 14C–10Be Bayesian isochron approach for interpreting complex glacial histories, Quatern. Geochronol., 15, 61–66, https://doi.org/10.1016/j.quageo.2012.11.007, 2013.
Gomez, B. and Small, R. J.: Medial moraines of the Haut glacier d'Arolla, Valais, Switzerland: debris supply and implications for moraine formation, J. Glaciol., 31, 303–307, 1985.
Gosse, J. C. and Phillips, F. M.: Terrestrial in situ cosmogenic nuclides: theory and application, Quaternary Sci. Rev., 20, 1475–1560, https://doi.org/10.1016/S0277-3791(00)00171-2, 2001.
Granger, D. E., Kirchner, J., and Finkel, R.: Spatially averaged long-term erosion rates measured from in situ-produced cosmogenic nuclides in alluvial sediment, J. Geol., 104, 249–257, 1996.
Gruber, S.: Derivation and analysis of a high-resolution estimate of global permafrost zonation, The Cryosphere, 6, 221–233, https://doi.org/10.5194/tc-6-221-2012, 2012.
Gruber, S. and Haeberli, W.: Permafrost in steep bedrock slopes and its temperature-related destabilization following climate change, J. Geophys. Res., 112, F02S18, https://doi.org/10.1029/2006JF000547, 2007.
Guillon, H., Mugnier, J.-L., and Buoncristiani, J.-F.: Proglacial sediment dynamics from daily to seasonal scales in a glaciated Alpine catchment (Bossons glacier, Mont Blanc massif, France), Earth Surf. Proc. Land., 43, 1478–1495, https://doi.org/10.1002/esp.4333, 2017.
Hales, T. C. and Roering, J. J.: Climatic controls on frost cracking and implications for the evolution of bedrock landscapes, J. Geophys. Res., 112, F02033, https://doi.org/10.1029/2006JF000616, 2007.
Hantz, D., Corominas, J., Crosta, G. B., and Jaboyedoff, M.: Definitions and Concepts for Quantitative Rockfall Hazard and Risk Analysis, Geosciences, 11, 158, https://doi.org/10.3390/geosciences11040158, 2021.
Hauke, J. and Kossowski, T.: Comparison of Values of Pearson's and Spearman's Correlation Coefficients on the Same Sets of Data, Quaestiones Geographicae, 30, 87–93, https://doi.org/10.2478/v10117-011-0021-1, 2011.
Heimsath, A. M. and McGlynn, R.: Quantifying periglacial erosion in the Nepal high Himalaya, Geomorphology, 97, 5–23, https://doi.org/10.1016/j.geomorph.2007.02.046, 2008.
Heisinger, B., Niedermayer, M., Hartmann, F. J., Korschinek, G., Nolte, E., Morteani, G., Neumaier, S., Petitjean, C., Kubik, P., Synal, A., and Ivy-Ochs, S.: In situ production of radionuclides at great depths. Nucl. Instrum. Meth. Phys. Res. Sect. B, 123, 341–346, https://doi.org/10.1016/S0168-583X(96)00702-1, 1997.
Hindmarsh, R.: A numerical comparison of approximations to the Stockes equation used in ice sheet and glacier modeling, J. Geophys. Res., 109, F01012, https://doi.org/10.1029/2003JF000065, 2004.
Jouvet, G. and Cordonnier, G.: Ice-flow model emulator based on physics-informed deep learning, Cambridge University Press, 1–15, https://doi.org/10.1017/jog.2023.73, 2023.
Jouvet, G. and Funk, M.: Modelling the trajectory of the corpses of mountaineers who disappeared in 1926 on Aletschgletscher, J. Glaciol., 60, 255–261, 2014.
Kirkbride, M. P. and Deline, P.: The formation of supraglacial debris covers by primary dispersal from transverse englacial debris bands, Earth Surf. Proc. Land., 38, 1779–1792, https://doi.org/10.1002/esp.3416, 2013.
Kober, F., Hippe, K., Salcher, B., Ivy-Ochs, S., Kubik, P. W., Wacker, L., and Hählen, N.: Debris-flow–dependent variation of cosmogenically derived catchment-wide denudation rates, Geology, 40, 935–938, https://doi.org/10.1130/G33406.1, 2012.
Kohn, B., Ketcham, R., Vermeesch, P., Boone, S., Hasebe, N., Chew, D., Bernet, M., Chung, L., Danisik, M., Gleadow, A., and Sobel, E.: Interpreting and reporting fission-track chronological data, Geol. Soc. Am. Bull., https://doi.org/10.1130/B37245.1, 2024.
Kořínková, D., Svojtka, M., and Kalvoda, J.: Rate of erosion and exhumation of crystalline rocks in the Hunza Karakoram defined by apatite fission track analysis, Acta Geodynam. Geomater., 11, 1–17, https://doi.org/10.13168/AGG.2014.0010, 2014
Korschinek, G., Bergmaier, A., Faesterman, T., Gerstmann, U. C., Knie, K., Rugel, G., Wallner, A., Dillmann, I., Dollinger, G., Lierse von Gostomski, C., Kossert, K., Maiti, M., Poutivsev, M., and Remmert, A.: A new value for the half-life of 10Be by heavy-Ion elastic recoil detection and liquid scintillation counting, Nucl. Instrum. Meth. Phys. Res. Sect. B, 268, 187–191, https://doi.org/10.1016/j.nimb.2009.09.020, 2010.
Krautblatter, M., Funk, D., and Günzel, F. K.: Why permafrost rocks become unstable: a rock-ice-mechanical model in time and space, Earth Surf. Proc. Land., 38, 876–887, 2013.
Legay, A., Magnin, F., and Ravanel, L.: Rock temperature prior to failure: analysis of 209 rockfall events in the Mont Blanc massif (Western European Alps), Permafrost Periglac. Process., 32, 520–536, 2021.
Lifton, N., Sato, T., and Dunai, T. J.: Scaling in situ cosmogenic nuclide production rates using analytical approximations to atmospheric cosmic-ray fluxes, Earth Planet. Sc. Lett., 386, 149–160, https://doi.org/10.1016/j.epsl.2013.10.052, 2014.
Lliboutry, L. and Reynaud, D.: “Global dynamics” of a temperate valley glacier, Mer de Glace, and past velocities deduced from Forbes' bands, J. Glaciol., 27, 207–226, ]doi10.3189/S0022143000015367, 1981.
Löfgren, A., Zwinger, T., Råback, P., Helanow, C., and Ahlkrona, J.: Increasing numerical stability of mountain valley glacier simulations: implementation and testing of free-surface stabilization in Elmer/Ice, The Cryosphere, 18, 3453–3470, https://doi.org/10.5194/tc-18-3453-2024, 2024.
Magnin, F., Josnin, J.-Y., Ravanel, L., Pergaud, J., Pohl, B., and Deline, P.: Modelling rock wall permafrost degradation in the Mont Blanc massif from the LIA to the end of the 21st century, The Cryosphere, 11, 1813–1834, https://doi.org/10.5194/tc-11-1813-2017, 2017.
Magnin, F., Ravanel, L., Bodin, X., Deline, P., Malet, E., Krysiecki, J., and Schoeneich, P.: Main results of permafrost monitoring in the French Alps through the PermaFrance network over the period 2010–2022, Permafrost Periglac., 35, 3–23, https://doi.org/10.1002/ppp.2209, 2023.
Marrero, S. M., Phillips, F. M., Borchers, B., Lifton, N., Aumer, R., and Balco, G.: Cosmogenic nuclide systematics and the CRONUScalc program, Quatern. Geochronol., 31, 160–187, https://doi.org/10.1016/j.quageo.2015.09.005, 2016.
Martin, L. C. P., Blard, P.-H., Balco, G., Lavé, J., Delunel, R., Lifton, N., and Laurent, V.: The CREp program and the ICE-D production rate calibration database: A fully parameterizable and updated online tool to compute cosmic-ray exposure ages, Quatern. Geochronol., 38, 25–49, https://doi.org/10.1016/j.quageo.2016.11.006, 2017.
Masarik, J., Kollar, D., and Vanya, S.: Numerical simulation of in situ production of cosmogenic nuclides: Effects of irradiation geometry, Nucl. Instrum. Meth. Phys. Res. B, 172, 786–789, https://doi.org/10.1016/S0168-583X(00)00121-X, 2000.
Matmon, A., Haeussler, P. J., and Team, A.: Sediment sources and transport by the Kahiltna Glacier and other catchments along the south side of the Alaska Range, Alaska, Geosphere, 16, 787–805, https://doi.org/10.1130/GES02190.1, 2020.
Millan, R., Mouginot, J., Rabatel, A., and Morlighem, M.: Ice velocity and thickness of the world's glaciers. Nat. Geosci., 15, 124–129, https://doi.org/10.1038/s41561-021-00885-z, 2022.
Nichols, K. K., Bierman, P. R., Eppes, M. C., Caffee, M., Finkel, R., and Larsen, J.: Timing of surficial process changes down a Mojave Desert piedmont, Quatern. Res., 68, 151–161, https://doi.org/10.1016/j.yqres.2007.02.001, 2007.
Nocquet, J.-M, Sue, C., Walpersdorf, A., Tran, D., Lenôtre, N., Vernant, P., Cushing, E., Jouanne, F., Masson, F., Baize, S., Chery, J., and Beek, P.: Present-day uplift of the western Alps, Nat. Sci. Rep., 6, https://doi.org/10.1038/srep28404, 2016.
Norton, K. P. and Vanacker, V.: Effects of terrain smoothing on topographic shielding correction factors for cosmogenic nuclide-derived estimates of basin-averaged denudation rates, Earth Surf. Proc. Land., 34, 145–154, https://doi.org/10.1002/esp.1700, 2009.
Orr, E. N., Owen, L. A., Saha, S., and Caffee, M. W.: Rates of rockwall slope erosion in the upper Bhagirathi catchment, Garhwal Himalaya, Earth Surf. Proc. Land., 44, 3108–3127, https://doi.org/10.1002/esp.4720, 2019.
Orr, E. N., Owen, L. A., Saha, S., Hammer, S. J., and Caffee, M. W.: Rockwall Slope Erosion in the Northwestern Himalaya, J. Geophys. Res.-Earth, 126, https://doi.org/10.1029/2020JF005619, 2021.
Puchol, N., Lavé, J., Lupker, M., Blard, P. H., Gallo, F., France-Lanord, C., and Team ASTER: Grain-size dependent concentration of cosmogenic 10Be and erosion dynamics in a landslide-dominated Himalayan watershed, Geomorphology, 224, 55–68, https://doi.org/10.1016/j.geomorph.2014.06.019, 2014.
Ravanel, L. and Deline, P.: Climate influence on rockfalls in high-Alpine steep rockwalls: The north side of the Aiguilles de Chamonix (Mont Blanc massif) since the end of the `Little Ice Age', Holocene, 21, 357–365, https://doi.org/10.1177/0959683610374887, 2011.
Ravanel, L. and Deline, P.: A network of observers in the Mont-Blanc massif to study rockfall from high Alpine rockwalls, Geografia Fisica e Dinamica Quaternaria, 151–158, https://doi.org/10.4461/GFDQ.2013.36.12, 2013.
Ravanel, L., Allignol, F., Deline, P., Gruber, S., and Ravello, M.: Rock falls in the Mont Blanc Massif in 2007 and 2008, Landslides, 7, 493–501, https://doi.org/10.1007/s10346-010-0206-z, 2010.
Ravanel, L., Duvillard, P.-A., Astrade, L., Faug, T., Deline, P., Berthet, J., Cathala, M., Magnin, F., Baratier, A., and Bodin, X.: The Taconnaz Rockfall (Mont-Blanc Massif, European Alps) of November 2018: A Complex and At-Risk Rockwall-Glacier-Torrent Morphodynamic Continuum, Appl. Sci., 13, 9716, https://doi.org/10.3390/app13179716, 2023.
Rowan, A. V., Egholm, D. L., Quincey, D. J., and Glasser, N. F.: Modelling the feedbacks between mass balance, ice flow and debris transport to predict the response to climate change of debris-covered glaciers in the Himalaya, Earth Planet. Sc. Lett., 430, 427–438, 2015.
Sarr, A. -C., Mugnier, J. -L., Abrahami, R., Carcaillet, J., and Ravanel, L.: Sidewall erosion: Insights from in situ-produced 10Be concentrations measured on supraglacial clasts (Mont Blanc massif, France), Earth Surf. Proc. Land., 44, 1930–1944, https://doi.org/10.1002/esp.4620, 2019.
Schaefer, J. M., Codilean, A. T., Willenbring, J. K., Lu, Z.-T., Keisling, B., Fülöp, R.-H., and Val, P.: Cosmogenic nuclide techniques, Nat. Rev. Meth. Primers, 2, 18, https://doi.org/10.1038/s43586-022-00096-9, 2022.
Scherler, D. and Egholm, D. L.: Production and Transport of Supraglacial Debris: Insights From Cosmogenic 10Be and Numerical Modeling, Chhota Shigri Glacier, Indian Himalaya, J. Geophys. Res.-Earth, 125, https://doi.org/10.1029/2020JF005586, 2020.
Scherler, D., Bookhagen, B., and Strecker, M. R.: Hillslope-glacier coupling: the interplay of topography and glacial dynamics in High Asia, J. Geophys. Res.-Earth, 116, 1–21, 2011.
Schwanghart, W. and Scherler, D.: Short Communication: TopoToolbox 2 – MATLAB-based software for topographic analysis and modeling in Earth surface sciences, Earth Surf. Dynam., 2, 1–7, https://doi.org/10.5194/esurf-2-1-2014, 2014.
Searle, M. P., Noble, S. R., Hurford, A. J., and Rex, D. C.: Age of crustal melting, emplacement and exhumation history of the Shivling leucogranite, Garhwal Himalaya, Geol. Mag., 136, 513–525, https://doi.org/10.1017/S0016756899002885, 1999.
Seong, Y. B., Owen, L. A., Caffee, M. W., Kamp, U., Bishop, M. P., Bush, A., Copland, L., and Shroder, J. F.: Rates of basin-wide rockwall retreat in the K2 region of the Central Karakoram defined by terrestrial cosmogenic nuclide 10Be, Geomorphology, 107, 254–262, https://doi.org/10.1016/j.geomorph.2008.12.014, 2009.
Small, E. E., Anderson, R. S., Repka, J. L., and Finkel, R.: Erosion rates of alpine bedrock summit surfaces deduced from in situ 10Be and 26Al, Earth Planet. Sc. Lett., 150, 413–425, https://doi.org/10.1016/S0012-821X(97)00092-7, 1997.
Small, R. J., Clark, M. J., and Cawse, T. J. P.: The Formation of Medial Moraines on Alpine Glaciers, J. Glaciol., 22, 43–52, https://doi.org/10.3189/S0022143000014040, 1979.
Sternai, P., Sue, C., Husson, L., Serpelloni, E., Becker, T. W., Willett, S. D., Faccenna, C., DiGiulio, A., Spada, G., Jolivet, L., Valla, P., Petit, C., Nocquet, J. M., Walpersdorf, A., and Castelltort, S.: Present-day uplift of the European Alps: evaluating mechanisms and models of their relative contributions, Earth-Sci. Rev., 190, 589–604, 2019.
Van Zelst, I., Crameri, F., Pusok, A., Glerum, A., Dannberg, J., and Thieulo, C.: 101 geodynamic modelling: how to design, interpret, and communicate numerical studies of the solid Earth, Solid Earth, 13, 583–637, https://doi.org/10.5194/se-13-583-2022, 2022.
Vernon, A. J., Van Der Beek, P. A., Sinclair, H. D., and Rahn, M. K.: Increase in late Neogene denudation of the European Alps confirmed by analysis of a fission-track thermochronology database, Earth Planet. Sc. Lett., 270, 316–329, https://doi.org/10.1016/j.epsl.2008.03.053, 2008.
von Blanckenburg, F.: The control mechanisms of erosion and weathering at basin scale from cosmogenic nuclides in river sediment, Earth Planet. Sc. Lett., 242, 224–239, 2006.
von Blanckenburg, F. and Willenbring, J. K.: Cosmogenic Nuclides: Dates and Rates of Earth-Surface Change, Elements, 10, 341–346, https://doi.org/10.2113/gselements.10.5.341, 2014.
von Blanckenburg, F., Hewawasam, T., and Kubik, P.: Cosmogenic nuclide evidence for low weathering and denudation in the wet, tropical highlands of Sri Lanka, J. Geophys. Res.-Earth, 109, https://doi.org/10.1029/2003JF000049, 2004.
Wang, Y. and Willett, S. D.: Escarpment retreat rates derived from detrital cosmogenic nuclide concentrations, Earth Surf. Dynam., 9, 1301–1322, https://doi.org/10.5194/esurf-9-1301-2021, 2021.
Ward, D. J. and Anderson, R. S.: The use of ablation-dominated medial moraines as samplers for 10Be-derived erosion rates of glacier valley walls, Kichatna Mountains, AK, Earth Surf. Proc. Land, 36, 495–512, https://doi.org/10.1002/esp.2068, 2011.
Wetterauer, K. and Scherler, D.: Spatial and temporal variations in rockwall erosion rates derived from cosmogenic 10Be in medial moraines at five valley glaciers around Pigne d'Arolla, Switzerland, Earth Surf. Dynam., 11, 1013–1033, https://doi.org/10.5194/esurf-11-1013-2023, 2023.
Wetterauer, K., Scherler, D., Anderson, L. S., and Wittmann, H.: Temporal evolution of headwall erosion rates derived from cosmogenic nuclide concentrations in the medial moraines of Glacier d'Otemma, Switzerland, Earth Surf. Proc. Land., 47, 2437–2454, https://doi.org/10.1002/esp.5386, 2022.
Wittmann, H., von Blanckenburg, F., Kruesmann, T., Norton, K., and Kubik, P.: Relation between rock uplift and denudation from cosmogenic nuclides in river sediment in the Central Alps of Switzerland, J. Geophys. Res., 112, F04010, https://doi.org/10.1029/2006JF000729, 2007.
- Abstract
- Introduction
- A method that links cosmogenic nuclide to supraglacial clasts and rockwall erosion rate
- Application of the supraglacial clasts method by previous studies
- Comparative synthesis of supraglacial clasts research
- Good practices and perspectives
- Conclusion
- Data availability
- Author contributions
- Competing interests
- Disclaimer
- Acknowledgements
- Financial support
- Review statement
- References
- Supplement