the Creative Commons Attribution 3.0 License.
the Creative Commons Attribution 3.0 License.
Fuzzy difference and data primitives: a transparent approach for supporting different definitions of forest in the context of REDD+
Werner Kuhn
This paper explores the use of fuzzy difference methods in order to understand the differences between forest classes. The context for this work is provided by REDD+, which seeks to reduce the net emissions of greenhouse gases by rewarding the conservation of forests in developing countries. REDD+ requires that local inventories of forest are undertaken and payments are made on the basis of the amount of forest (and associated carbon storage). At the most basic level this involves classifying land into forest and non-forest. However, the critical issues affecting the uptake, buy-in and ultimately the success of REDD+ are the lack of universally agreed definition of forest to support REDD+ mapping activities, and where such a definition is imposed, the marginalization of local community voices and local landscape conceptualizations. This tension is at the heart of REDD+. This paper addresses these issues by linking methods to quantify changes in fuzzy land cover to the concept of data primitives, which have been previously proposed as a suitable approach to move between land cover classes with different semantics. These are applied to case study that quantifies the difference in areas for two definitions of forest derived from the GLC and FAO definitions of forest. The results show how data primitives allow divergent concepts of forest to be represented and mapped from the same data and how the fuzzy sets approach can be used to quantify the differences and non-intersections of different concepts of forest. Together these methods provide for transparent translations between alternative conceptualizations of forest, allowing for plural notions of forest to be mapped and quantified. In particular, they allow for moving from an object-based notion of forest (and land cover in general) to a field-based one, entirely avoiding the need for forest boundaries.
- Article
(6075 KB) - Full-text XML
- BibTeX
- EndNote


This paper suggests and applies an alternative approach for classifying and mapping land cover, using the example of forest in the context of Reducing Emissions from Deforestation and Forest Degradation (REDD and REDD+). REDD+ Initiatives seek to reduce the net emissions of greenhouse gases by rewarding the conservation of forests in developing countries (Angelsen, 2009). REDD+ requires that local inventories of forest are undertaken and payments are made on the basis of the amount of forest (and associated carbon) that are mapped. At the most basic level this involves classifying land into forest and non-forest.
The problem encountered by many forest monitoring strategies under REDD+ is how to accommodate divergent conceptualizations of “forest” such that local interpretations are reflected in forest mapping while providing a transparent tool for carbon accounting. The International Panel on Climate Change (IPCC) recommends the use of an internationally recognized forest definition (e.g. that of the Food and Agricultural Organisation, FAO) but even within the United Nations Framework Convention on Climate Change (UNFCCC) there are no agreed definitions (Romijn et al., 2013). The flexibility of REDD+ allows forest to be defined locally, but ultimately requires mappings to be transparent (Gupta et al., 2014; Ryan et al., 2014), in order for forest estimates to be accurate and payments to be justified. There are well established reasons for not having a standard definition of forest (see Comber et al., 2007, for an extensive discussion on the problems caused by the imposition of standards in land cover mapping). Not least among these is that local considerations and landscape conceptualizations are ignored (Hoeschele, 2000; Robbins, 2001) to the detriment of local stakeholders. However, there can be considerable disagreement over the amount of forest, when mapped under different classifications. For example, Romijn et al. (2013) compared the forest stock levels in Indonesia when mapped using local forest definitions and using FAO definitions and found the extent of forest to be 27 % higher when using the local definition.
The critical issues addressed by this paper are how to allow for these divergent landscape conceptualizations within mapping and how to avoid possibly inaccurate estimates of forest extent. The analysis applies a methodology that links data primitives (Comber, 2008; Wadsworth et al., 2008) and soft classifications. It applies these to classifications of forest from the Global Land Cover (GLC) project as described in Bartholome and Belward (2005) and from the FAO (Di Gregorio and Jansen, 1998). It shows how these can be re-interpreted using soft classifications to explore the overlaps and boundaries between different versions of forest. The data primitive approach allows the critical dimensions associated with land cover and land use to be captured as well as the inherent relative uncertainty in class definitions. It provides a shared, transparent, robust and well understood method for mapping and reporting forested areas and for supporting global policy initiatives such as REDD+, whilst at the same time accommodating local divergence in forest semantics – and the way that “forest” (and therefore the boundary with non-forest) is conceptualized spatially.
To situate our approach, we first provide the necessary background on land cover classification, the problems with REDD+ in relation to crisp definitions of forest and the uncertainty in forest definitions, and the concepts of fuzzy boundaries and fuzzy differences.
2.1 Land cover classification
Classification, the process of sorting real world phenomena into categories or classes, is a core activity within geography and many other disciplines. Classes describe groups of social and environmental phenomena with broadly similar characteristics. Land cover classes are used to describe the physical characteristics of the earth's surface and land use classes describe the socio-economic activities thereon. Typical land cover classes include water, grass and forest; typical land use classes include agriculture, forestry and urban. There is an extensive literature on the different philosophical underpinnings of the way that land cover and land use classes are conceptualized (e.g. Comber et al., 2005; Fisher et al., 2005), including for specific classes such as forest (Bennet, 2001; Comber, 2008). This application based literature is complemented by more general considerations of the nature of classification (e.g. Lakoff, 1987) and by more formal research considering the nature of how to represent objects, processes and relationships of geographic phenomena in computer models and analyses (e.g. Kuhn, 2005, 2012).
Classification typically allocates each item uniquely to one class and this is true for land cover and land use, although much theoretical work exists suggesting alternative, soft classifications such as those supported by fuzzy sets (e.g. Fisher, 2010). All global land cover data produced for monitoring purposes and used as inputs to global climate change models adopt a crisp classification with hard boundaries between the resulting land cover objects of different classes. Thus, land cover classification is a process of homogenization that ignores any within class variation and, more critically, excludes any consideration of the potential for uncertainty in boundaries between classes. This contrasts with a well developed literature on boundary uncertainty within geography (Smith, 1995; Burrough and Frank, 1996), reflecting a vernacular definition of geography as “the art of drawing lines on a map that do not exist in reality”.
Classifications with crisp boundaries provide a convenient and familiar framework for representing environmental and social processes that are readily understood by policy makers. For example, in the sphere of climate change, REDD+ and climate models seek to standardize or “harmonize” definitions of forest and use crisp mappings of forested areas that may not exhibit crisp edges in reality and whose classification may be deeply contested. This culture of class definition standardization creates baseline inventories that ignore uncertainties and local variations in how land cover classes such as forest are conceptualized (semantics) and the functions associated with them. This can have serious political implications for the way that land is managed locally and for local discourses around land. This has become evident with the roll out of REDD+ in many developing countries, where fixed IPCC/UN definitions of “forest”, for the purpose of carbon accounting, are being used to drive land reform and privatization agendas. Local land cover interpretations are excluded from local and global decision making.
2.2 Forest definitions and REDD+
The REDD and REDD+ initiatives aim at mitigating climate change by reducing net emissions of greenhouse gases and financially rewarding enhanced forest management in developing countries. In simple terms, poor countries with forests are to be paid to not cut down their trees, with payments based on the amount of trees and carbon storage capacity they have. In order to support payments, the UN have suggested that countries should develop robust and transparent forest monitoring systems to record forest and carbon stocks and changes using a combination of remote sensing and field surveys (UNFCCC COP15, 2009), with each country defining what constitutes “forest”. This was to overcome the deeply contested nature of what a “forest” is (and land cover and land use classification in general), which is well established in the literature (see for example Hoeschele, 2000; Bennet, 2001; Robbins, 2001; Smith and Mark, 2001; Comber et al., 2005) and reflects commendable courage by the remote sensing community that is driving the REDD+ initiative. However, REDD+ activities require forest to be demarked, presenting a number of challenges, two of them being of critical importance.
First, any particular definition of forest and the associated mapping will determine the reported amount of forest, which will in turn affect the estimates of carbon storage (Magdon and Kleinn, 2012; Romijn et al., 2013). There are hundreds of forest definitions as documented by Lund (2016) and explored conceptually by Bennett (2001) and Comber et al. (2005) with profoundly different threshold parameters for height, stripwidth, minimum area, species (some include grasses such as bamboo), canopy, management and plantation cover etc. These are international, national and sub-national in scope and reflect locally important variations in the concept of “forest” and its semantics – what the concept is in the local context (not just the REDD+ context). Regarding REDD+, Morales-Barquero et al. (2014) highlight the difficulties in operationalizing local and national level REDD+ projects and programmes in Mexico. They present a framework that includes local definitions and measurements of forest degradation that support both local and national objectives and suggest the use of comparative biophysical benchmarks for assessing degradation. More recently, Chazdon et al. (2016) examined historical forest concepts and definitions and documented how these relate to variations in socio-economic activity. They note a number of problems with top-down forest definitions for assessing global changes in forest stocks: their failure to distinguish between natural and plantation forests and the lack of consideration of the qualities and trajectories of forested areas in standard approaches. In order to try to accommodate the divergence in the concept of forest, and to support consistency in carbon accounting, the UN requires robust and transparent national reporting of measurement systems, remote sensing and ground based forest carbon inventory data, the methods and the forest definitions used in national measurements (Herold et al., 2012a, b).
Second, national definitions and associated mappings are deeply political exercises that are frequently used to drive secondary local political agendas that exclude and are in conflict with local communities. Mapped forests, however they are defined, are presented locally as “facts”, which are then manipulated towards the interests of the state, excluding community views, perceptions and opinions from the classification and measurement activity. For example, there are cases of REDD+ projects being used locally to support the violent eviction of people from the land in many countries (Himmelfarb, 2012; Cavanagh and Benjaminsen, 2014; Grainger and Geary, 2011; Nel and Hill, 2013; Lyons and Westoby, 2014; Forest Peoples Programme, 2014; Beymer-Farris and Bassett, 2012). In other cases, national definitions are imposed and the subsequent mappings are used to support land privatization agendas and forest commodification with the objective of removing commonly held land from collective ownership (Ece, 2015). Critical to the success of REDD+, there are also problems in identifying the financial beneficiaries of carbon payments because the forested land lacks natural ownership divisions. A further negative dimension of REDD+ is that it often is used by local policy makers as an excuse to ignore and overlook the opinions and views of forest-dependent communities and indigenous forest-dwelling populations. Local understanding and knowledge are important for the forest conservation objectives of REDD+. For example, Bong et al. (2016) compared community knowledge of deforestation and degradation drivers amongst different Indonesian villages and found local knowledge to be key to understanding the local impacts of deforestation drivers. They highlighted the importance of incorporating local knowledge and conceptualizations within definitions of forest to develop more locally appropriate REDD+ monitoring systems. However, some communities in likely REDD+ countries do not hold a concept of forest at all (Niclas Burenhult, personal communication, 2016) and where they do this has a nuanced and spiritual meaning. Specifically, although the people of Jahai in the in the Malay Peninsula live in forests, they have no concept of forest (Burenhult, 2009). Instead it is their home and the nearest terms they have for forest-like things describe leaves and trees as well as canopy floor, covered area and exposed area.
The conclusion is that the requirement of REDD+ to demarcate forest is problematic in many places. Crisp mappings of forest do not reflect the many cultural, linguistic and ownership aspects of forest, whichever way the category is defined. Initiatives like REDD+, regardless of how well meaning they are, result in a clash of categories with the consequence that important forest related parameters are overlooked. These wide ranging negative implications for forest-dependent communities and indigenous forest-dwelling populations threaten forest conservation in developing countries and as a consequence have been referred to as the dark side of REDD+ (Cavanagh et al., 2015).
The core issue that REDD+ mappings exemplify is the inherent uncertainty associated with the concept like “forest”. It is both a vague and ambiguous concept (Fisher et al., 2006b, c; Comber et al., 2006). Fisher et al. (2006a) describe a taxonomy of uncertainty for geographic objects, with a particular focus on land cover. This describes different types of uncertainty as being related to how well the geographic objects and classes of object are defined. They describe well defined object classes that are easily, and uncontestedly, separable from other object classes. In such cases any uncertainty is related measurement error which can be analysed using probabilities. However, for objects whose definitions are less well defined (poorly defined object classes), and that are contested such as forest, the uncertainties relate to vagueness or ambiguity. Vagueness occurs when it is difficult to unequivocally allocate an individual object to a class, for example because of disagreement about its components or its extent. Ambiguity occurs when an object can be placed into more than one class under different schemes or interpretation of the evidence, or when the assignment of an object to a class is open to interpretation. The concept of “forest” in the context of REDD+ is both vague and ambiguous, depending on which side of the (mapping) fence you are on.
2.3 Fuzzy boundaries and difference
In fuzzy land classifications, each piece of land or object (for example, the piece corresponding to a pixel in a satellite image) is allocated a degree of membership to each class in the range [0, 1] (Fisher and Pathirana, 1990). This allows each object to have partial membership to more than one land cover class. For these reasons fuzzy approaches are frequently referred to as “soft” classifications as the fuzzy outputs include and represent some of the inherent uncertainty associated with allocating objects to classes (Fisher, 1997). This is in contrast to “hard” or Boolean approaches, which do not accommodate any uncertainty. For these reasons fuzzy sets and fuzzy classification algorithms have been suggested as appropriate approaches in remote sensing analyses for representing land cover objects which may or may not fit neatly into the classification scheme and/or the sampling frame (pixel).
In a standard land cover classification, class summaries or centres are created that describe the (proto-) typical class properties usually in an n-dimensional feature space, for example representing different remote sensing image bands, or as in this case, data primitives as described below. In a Boolean classification each piece of land is allocated to the class to which it is nearest in the feature space. Different algorithms create the class centres and measure distances in n-dimensional space in different ways. The issue that fuzzy classifications seek to address is that a piece of land may be near to more than one class, suggesting that it contains some of the properties of more than one classes, resulting in a degree of ambiguity (Fisher et al., 2006a) in the allocation.
A second commonly arising problem that fuzzy classifications seek to address relates to the sampling frame. The assumption in mapping land cover using remote sensing is that the objects of interest on the ground are adequately described and captured by the imagery. The inference is that the spatial scale of the processes on the ground (such as land cover) are larger than the pixel and that contiguous pixels will describe the extent of these processes. In reality there are many sub-pixel objects on the ground (Fisher, 1997) arising from a mismatch between the scale of observation and the granularity of the processes being observed (Fisher et al., 2007). Fuzzy sets seek to accommodate these problems related to the pixel in the mapping of sub-pixel objects (less than the size of a pixel), trans-pixel objects (linear objects crossing pixels), intergrades (where land cover types merge into each other over space) and boundaries (where multiple covers meet within one pixel).
Conceptually, fuzzy approaches have potential value to operational land cover monitoring exercises such as REDD+ because they can explicitly accommodate the uncertainty inherent to classification. Here these the concepts of fuzzy minimum interval, fuzzy bounded difference and fuzzy loss and gain are extended to examine the differences between two fuzzy classifications as described in Sect. 3.
2.4 Land cover objects vs. land cover fields
The typical land cover classification process described above results in crisp and hard boundaries between classes in attribute space as well as between the resulting regions on the ground. It is therefore tempting to interpret these regions as land cover objects with boundaries and identity. To quantify a country's amount of, for example, forest, one simply adds the surface areas of all forest objects in that country at a given time.
Yet, for the reasons stated in the previous subsection, such an outcome of land cover classification is not satisfactory. In particular, for the case of forests, it is unsuitable to deal with partial deforestation and forest degradation. Forests do not simply disappear from their boundaries inward by converting pieces of forests to non-forests. Rather, deforestation and forest degradation proceed as gradual reductions of “forestness” of pieces of land, as might occur, for example, through a systematic thinning of tree density.
It turns out that fuzzy boundaries and differences, or rather fuzzy membership values for pieces of land in a land use category, provide exactly the mathematical model needed to deal with such an idea of forestness. As the following analysis section will show, they generate feature vectors for each piece of land corresponding to, for example, a pixel. In Geographic Information Systems (GIS), such arrays of vectors of observed values are known as vector fields. Thus, using the classic dichotomy of fields vs. objects (Couclelis, 1992), we conclude that forests are much more adequately conceptualized as fields rather than as objects.
To illustrate the proposed method, this paper uses the case study of translating land cover data describing forest in North America to another classification. In this case we convert the 6 GLC forest classes to the FAO class of forest. The approach is to characterize the classified data using data layers referred to as data primitives (Comber et al., 2008; Wadsworth et al., 2008), which enable each class to be described at the most fundamental level. In the terminology of GIS field models, data primitives are the dimensions of the forest field vector.
Defining land based objects not by their spectral properties but by their fundamental functional and biophysical characteristics has been suggested by a number of authors. Such data primitives characterize the building blocks of land cover and land use. They are fundamental because they seek to describe land cover and land use classes in dimensions that encapsulate what such classes mean and represent. The objective in describing categories of things such as forest in this way, referred to as “conceptual spaces”, “approximation spaces” and “domains”, is to generate descriptions of data features to allow the amount of overlap between them to be quantified. The approach is grounded in the work of Gardenfors (2000) and Ahlqvist (2004). Indeed, the FAO Land Cover Classification System (LCCS) developed by Di Gregorio and Jansen (1998) adopts a modified or constrained data primitives approach.
Here we use data describing vegetation height, biomass as a proxy for photo-synthetic activity, soil wetness, human disturbance and seasonality for the data primitives. The positions of each class in these dimensions are extracted. Then a new class of forest is defined using the same data primitives and subsequently mapped. The differences between the two soft, fuzzy mappings of forest within the primitives are explored and quantified and shown to provide a transparent and translatable comparison of different definitions and mappings of forest.
3.1 Data
The GLC data were downloaded and extracted for the USA. Five datasets were assembled to provide measures that approximated to the dimensions of vegetation height, biomass, soil wetness, human disturbance and seasonality; these were obtained from the following open data portals:
-
vegetation height: from Existing Vegetation Height data from http://www.landfire.gov/version_comparison.php?mosaic=Y;
-
biomass: from http://landcarbon.org/categories/biomass-c/download/ (gC m−2);
-
soil wetness and soil moisture: from http://giovanni.gsfc.nasa.gov/giovanni for the month of June for 0–100 cm depth;
-
human disturbance: proximity to mapped Urban and Managed land from GLC (classes 16, 17, 18, 22);
-
seasonality: phenology growing season data from the MODIS archive: Duration DUR Length of photosynthetic activity (number of days): https://lta.cr.usgs.gov/emodis_phen.
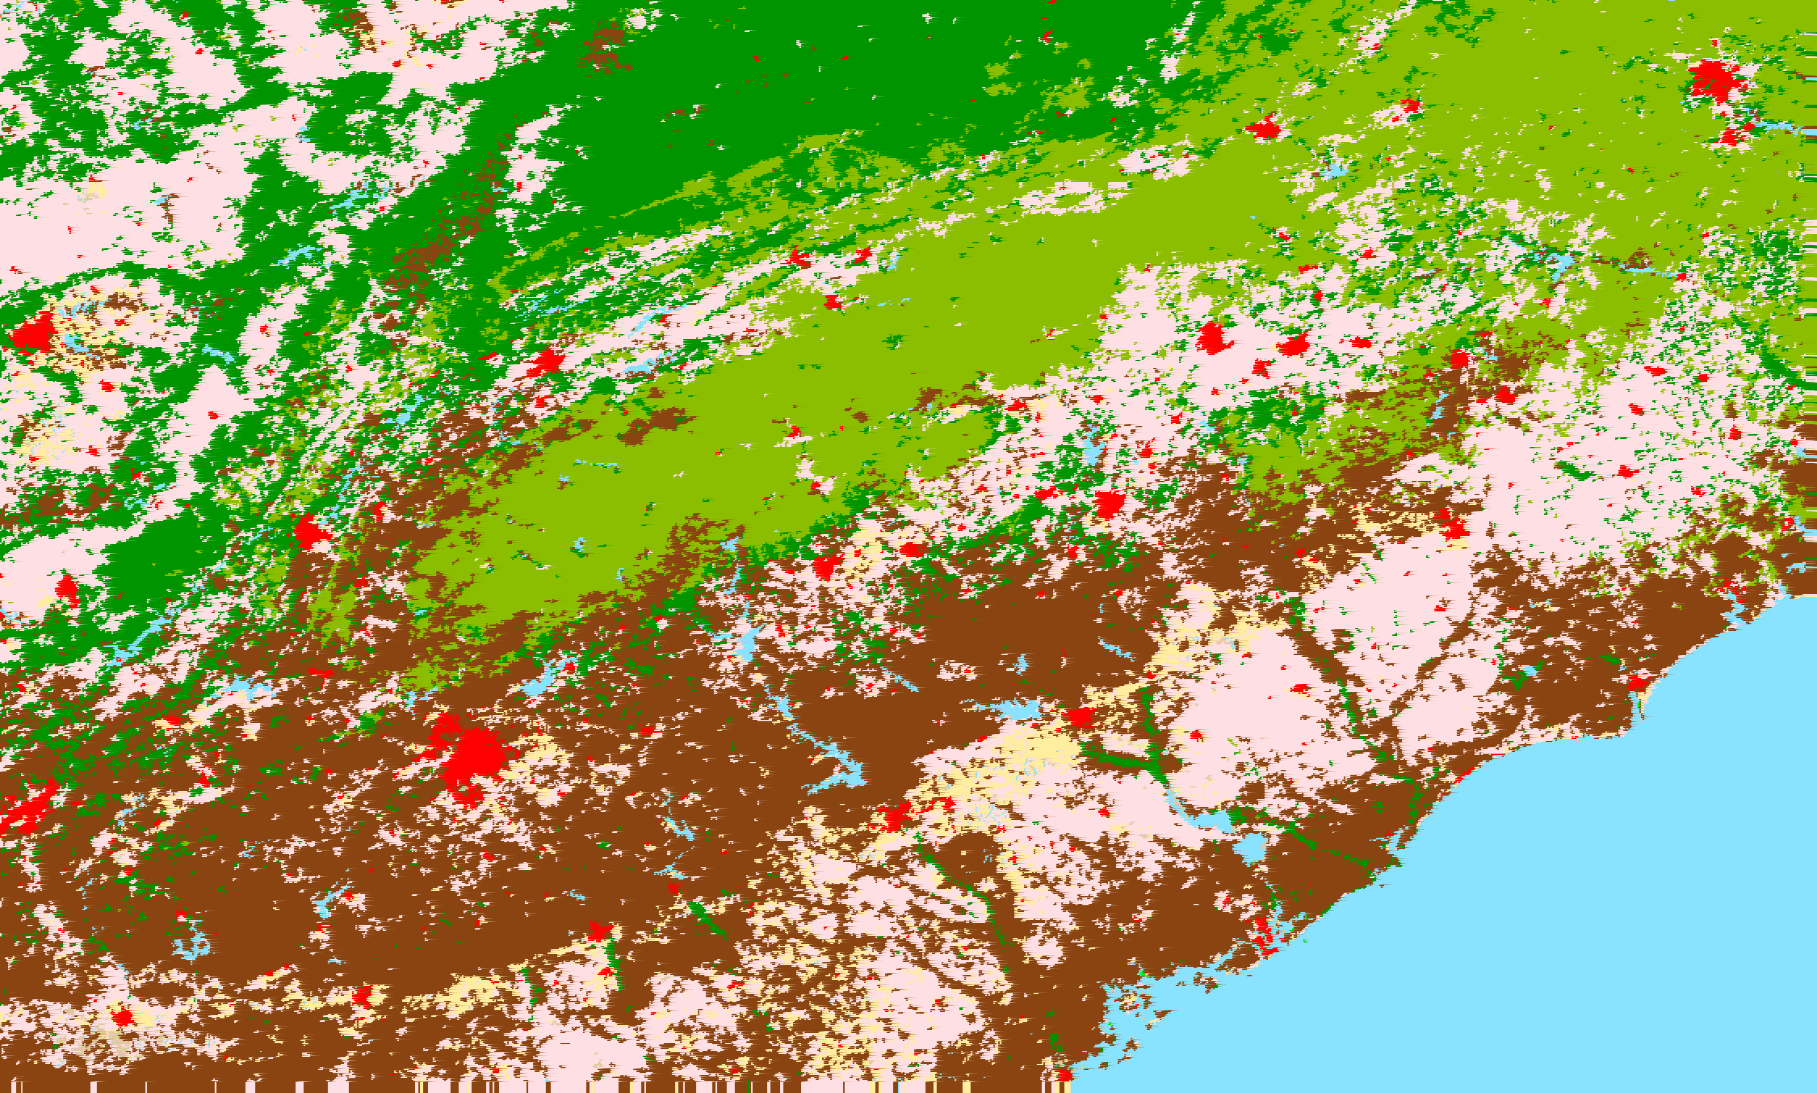
These were all resampled to 0.0217 of a degree, with the mean value used to aggregate the data, and clipped to a smaller case study area. The spatial distributions of these variables and the GLC data are shown in Figs. 1 and 2.
3.2 Class centres
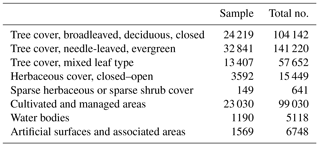
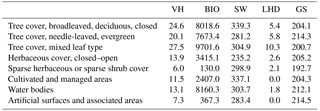
The typical characteristics of each of the GLC classes in each of the five dimensions were extracted by selecting a sample of GLC pixels from each class (Table 1), with the sample number weighted by the distribution of the class in the study area. The class centres are shown in Table 2.
Table 1The sample number and total distribution of the GLC classes.
3.3 Fuzzy classification: GLC and FAO
A fuzzy c-means classifier was used to generate soft classifications for each pixel in the study area. This algorithm used was the implementation of the fuzzy clustering method (e.g. Bezdek, 1981) in the e1071 R package (Meyer et al., 2012). The classifier generates fuzzy memberships in the range of [0, 1] to each class for each pixel. In this case the class centres were those in Table 2 and the classifier generated fuzzy memberships to the set of each class in the five primitive dimensions.
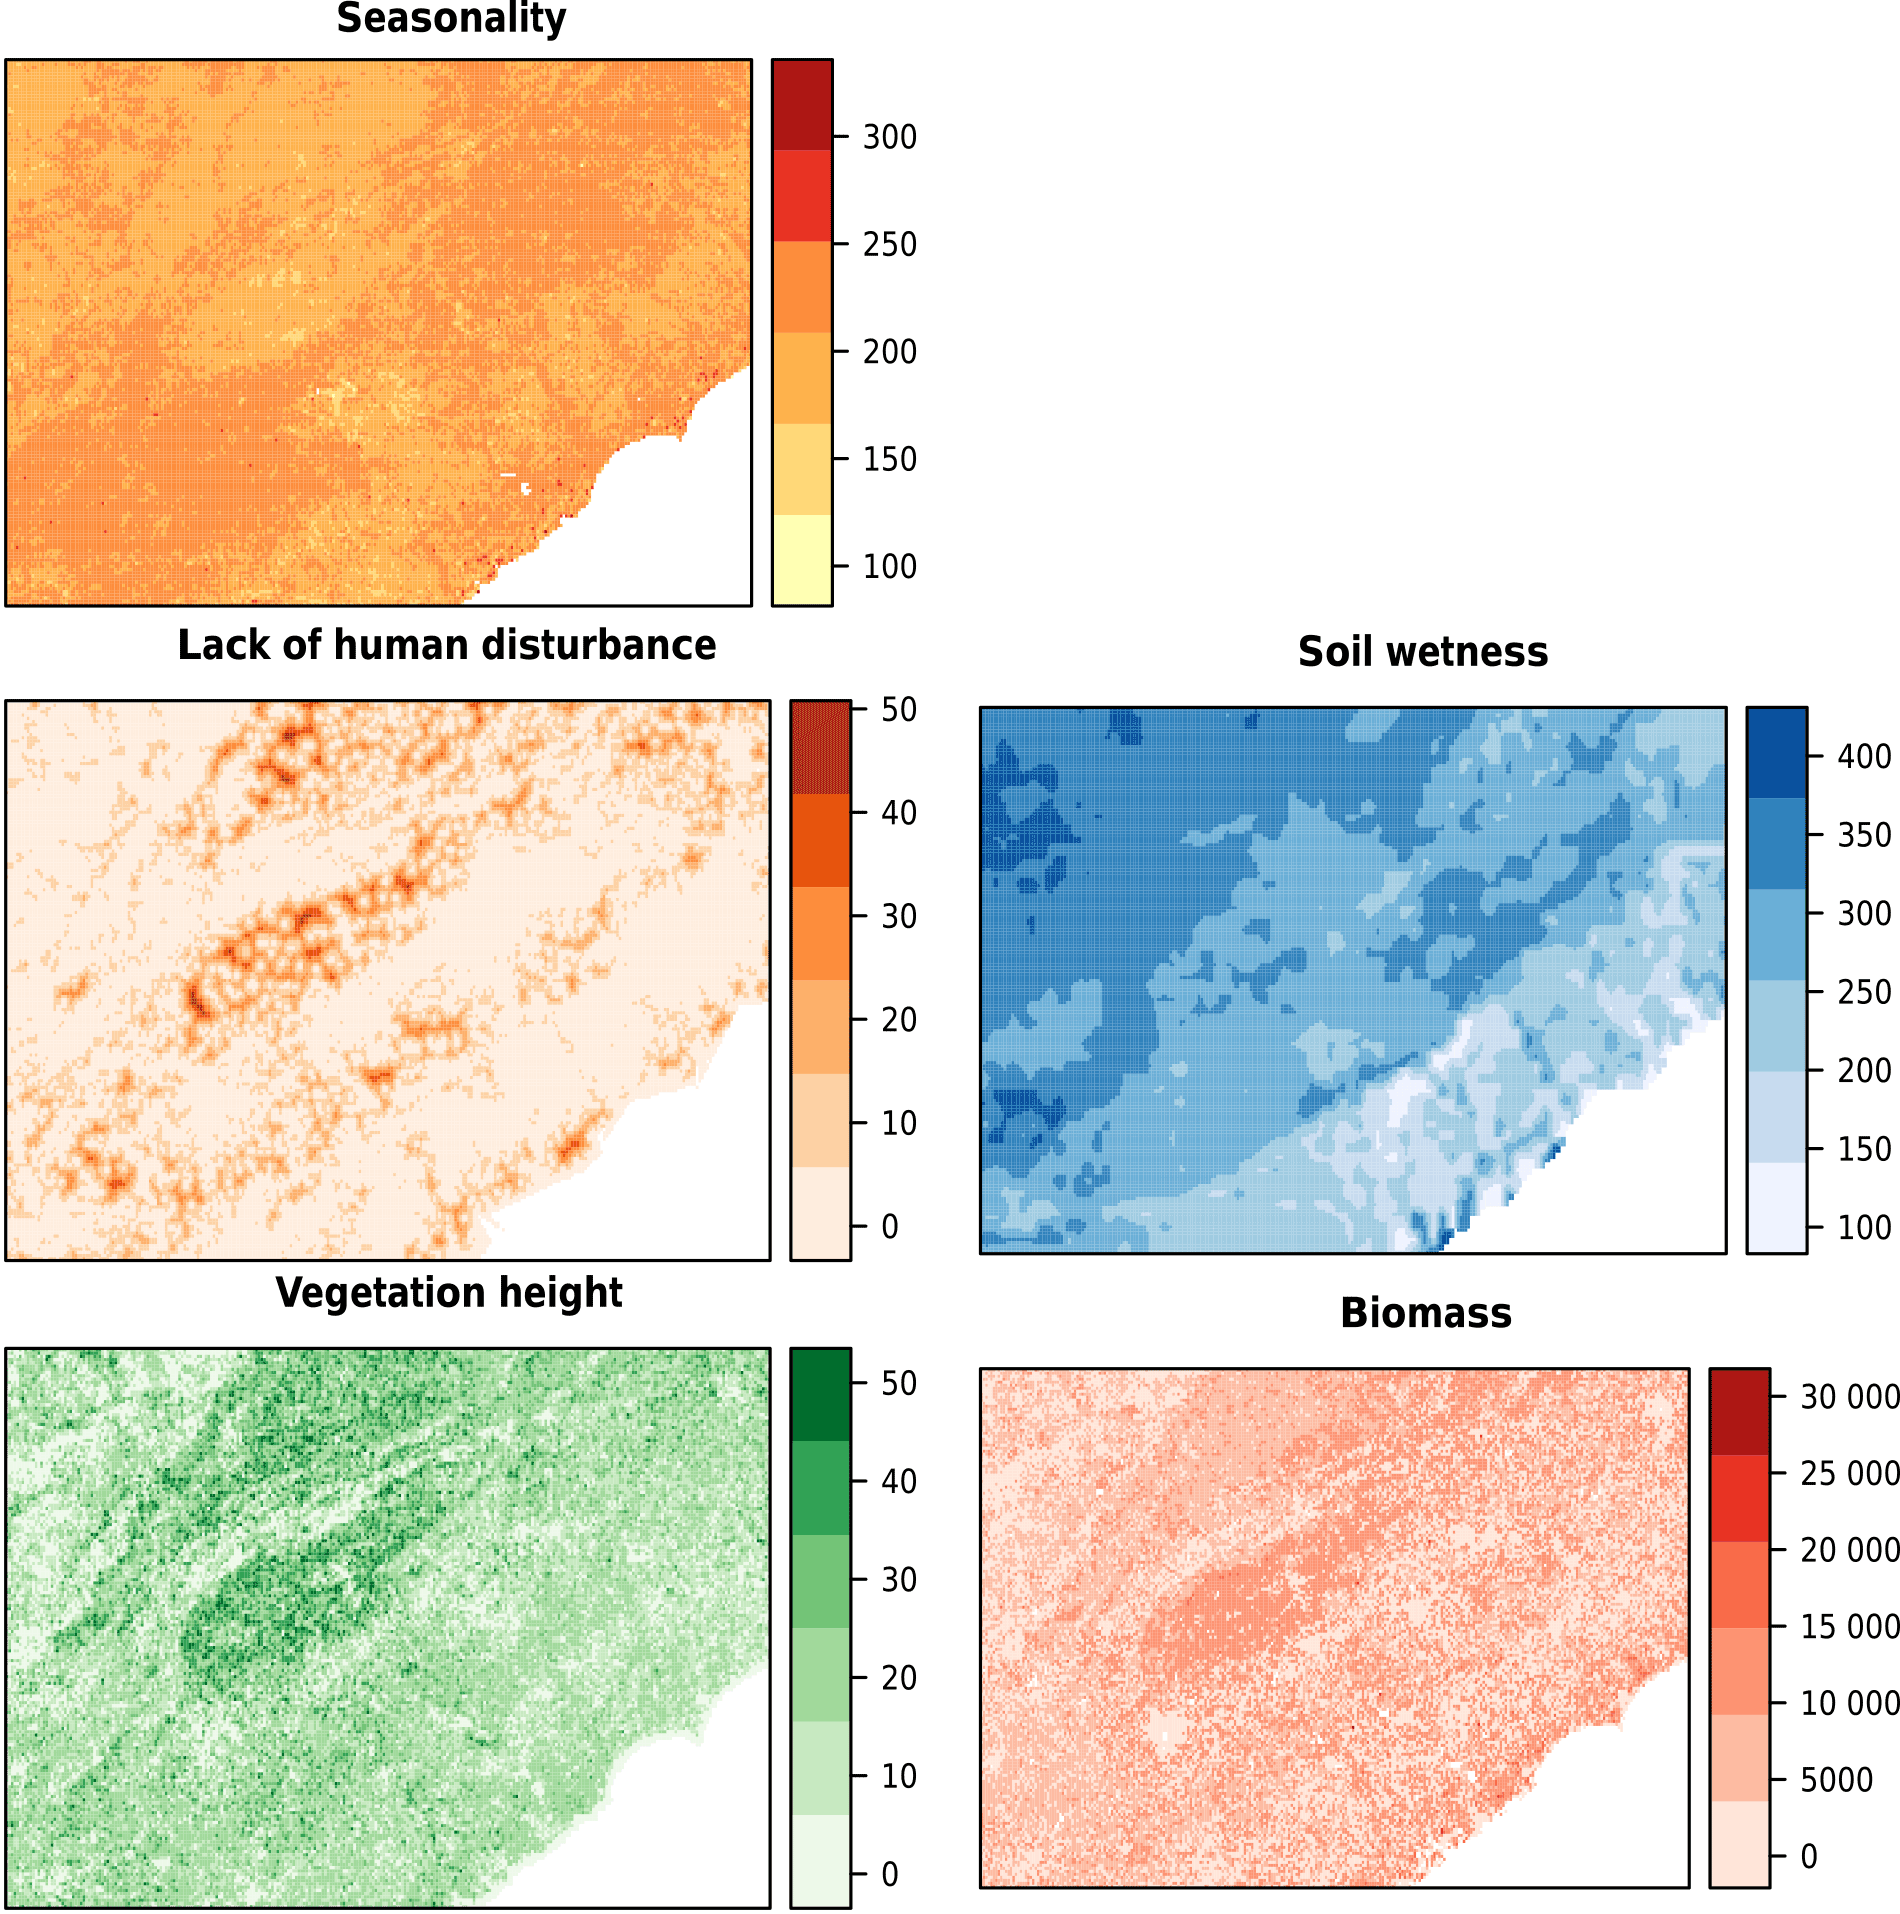
Figure 1The data primitives in the study area: Seasonality in photosynthetic activity (days), Lack of human disturbance (proximity Urban and Managed land) in km, Soil moisture (water) in kg m−2, Vegetation height in metres and Biomass in gC m−2.
The fuzzy c-means algorithm seeks to minimise the objective function:
where wi is the weight of observation (pixel) i, uij is the membership of observation i in cluster (class) j, and dij is the Euclidean distance (dissimilarity) between observation i and centre j. The fuzzy c-means algorithm generates a membership to each class for each pixel, based on their closeness to the class centres in Table 2. (Note that fuzzy memberships can be used to extract crisp values of the amount of forest and non-forest, depending on the classes of forest that are preferred, through the application of different alpha cuts.) Then, by combining all of the memberships for the three GLC forest classes, a fuzzy class of forest from the GLC classes was generated.
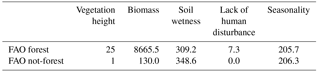
Finally, a second forest class was introduced. This was based on the FAO forest class definition (http://www.fao.org/docrep/006/ad665e/ad665e06.htm) and included the following key characteristics: tree crown cover, more than 10 % canopy cover, minimum height of 5 m although young and “temporarily unstocked” land can be included. By selecting a sample of forest pixels with the characteristics of being greater than 5 m and having greater than 10 % canopy cover, a second set of class centres in the five primitives was generated. These are shown in Table 3. The second fuzzy classification of forest was then generated using the c-means algorithm above, from the class centres.
Table 2The median values for each GLC in the 5 primitive dimensions: VH = Vegetation Height; BIO = Biomass; SW = Soil Wetness; LHD = Lack of Human Disturbance; GS = Seasonality.
3.4 Fuzzy boundaries and difference
The method for quantifying fuzzy differences between two classifications is based on that suggested by Fisher et al. (2006b). In this approach, the land cover at any location is considered to have potential memberships to each of the different classes being considered. That is, class membership is considered as a fuzzy set. Fuzzy intersections and non-intersections (parallel to fuzzy change) are determined using the fuzzy confusion (correspondence) matrix. In a change analysis this supports the calculation of fuzzy losses. Here, we are interested in the degree to which different concepts of forest overlap. The concepts of fuzzy loss and gain can be used to determine the areas of difference between the two classifications from the perspective of each concept of forest. This process is exemplified in the sections below.
Table 3The median values for each of the FAO Forest classes in the five primitive dimensions. The data primitives have the following units: Seasonality photosynthetic activity (days), Lack of human disturbance (proximity Urban and Managed land) km, Soil moisture (water) kg m−2, Vegetation height metres and Biomass gC m−2.
The fuzzy confusion (correspondence) matrix, describing the intersection between the two fuzzy forest classes, can be derived using the minimum interval or using the bounded difference of fuzzy loss and fuzzy gain. As Fisher et al. (2006b) noted, the minimum interval is the standard approach in fuzzy sets but is counter-intuitive when it is used to compare different classes – it only makes sense in the context of fuzzy land cover when comparing fuzzy sets of the same class but captured at different times (i.e. the diagonal in a change matrix). For these reasons a number of alternative operators have been suggested (Klir and Yuan, 1995; Leung, 1988; Zadeh, 1965) and as Fisher et al. (2006b:166) note, “Of these, the bounded difference between two fuzzy sets is the simplest operator for which the results make the most sense”.
Table 4Example fuzzy memberships for a hypothetical classification over 4x4 pixel dataset with three classes (a1, b1 and c1).
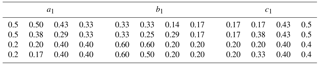
Table 5Example fuzzy memberships for a second hypothetical classification, again with three classes (a1, b1 and c1).
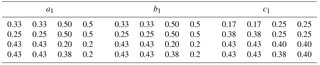
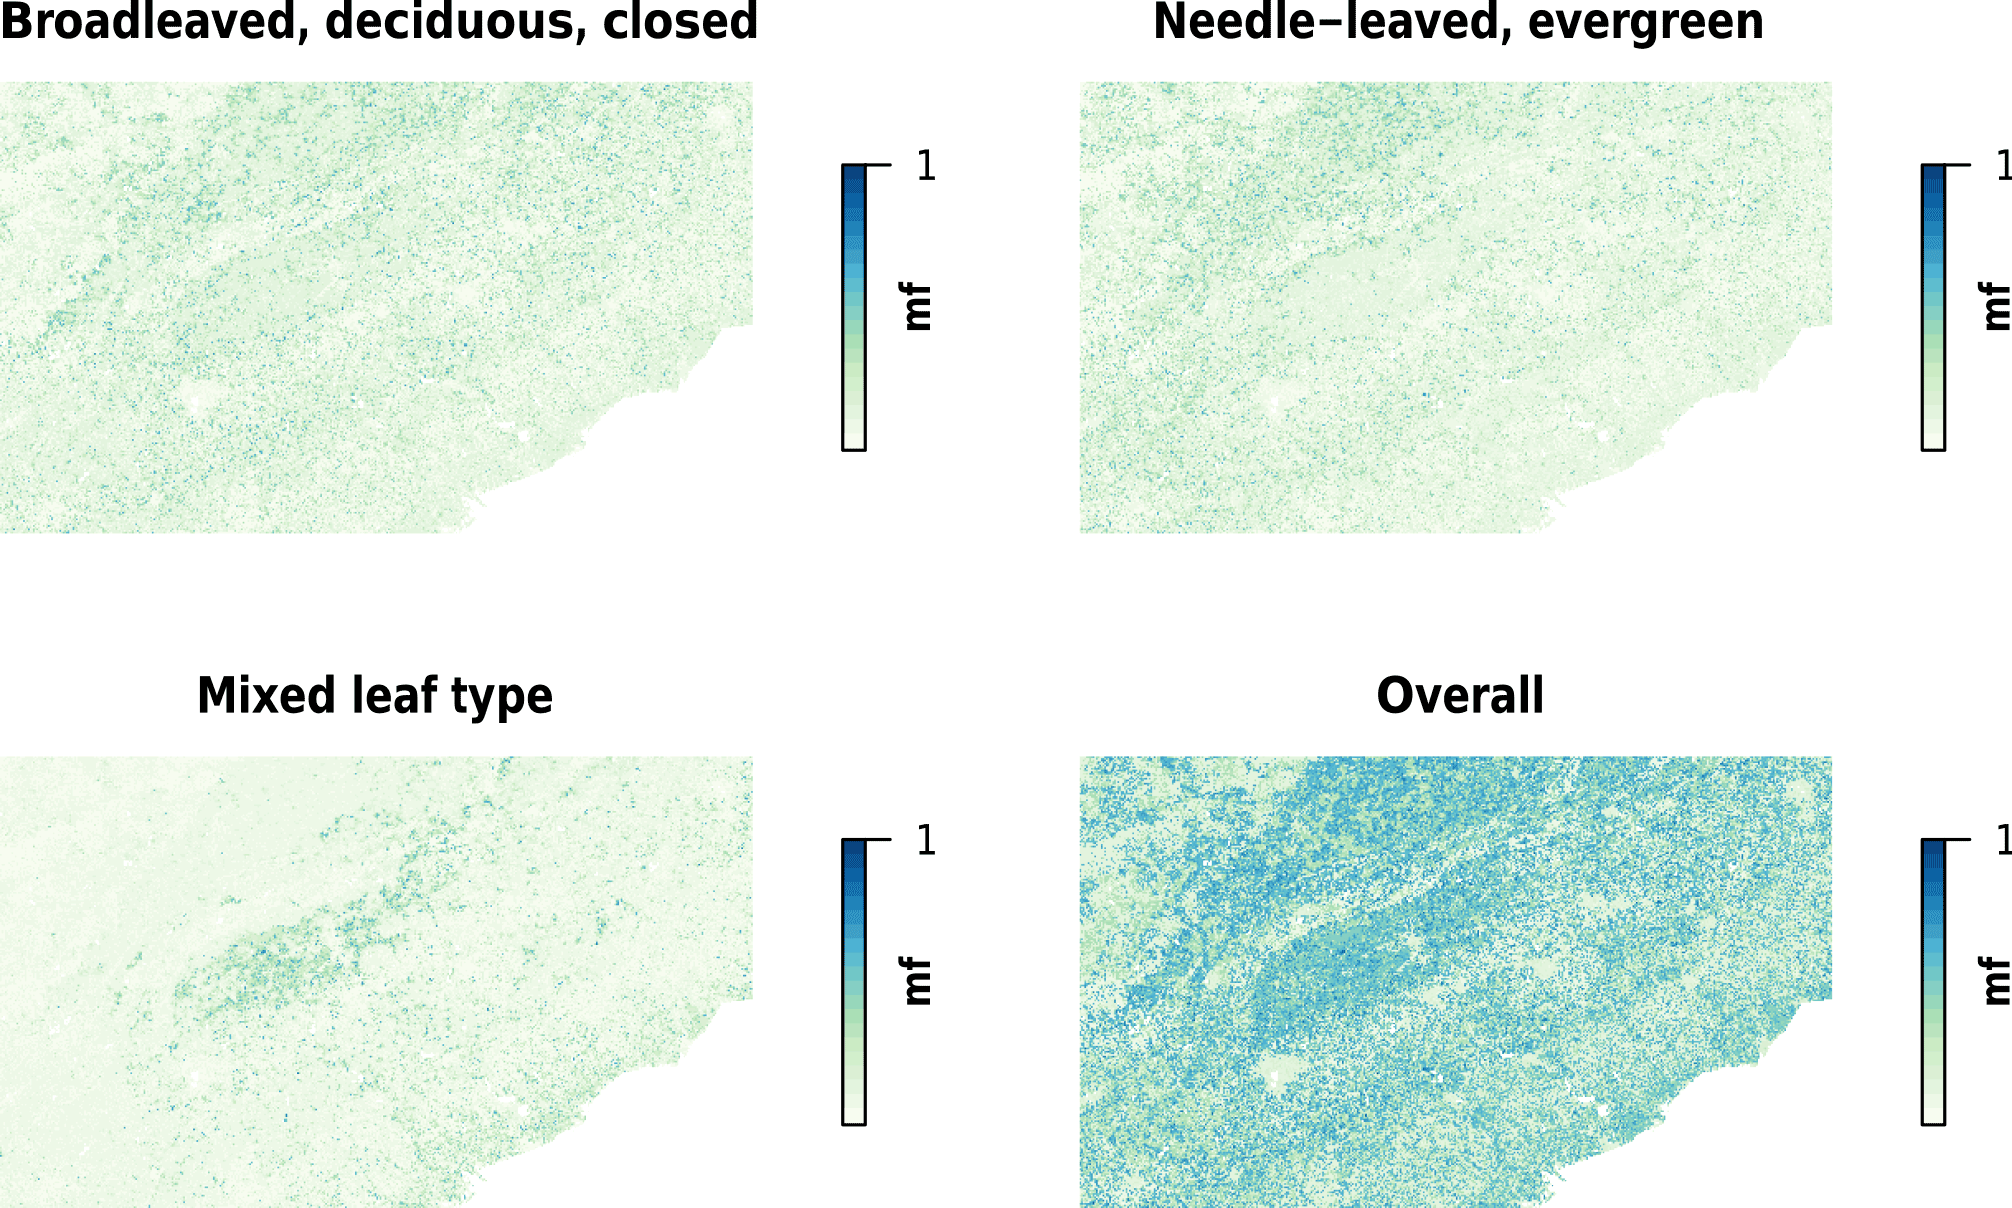
Figure 3The fuzzy membership to the three GLC forest classes in study area and their combined fuzzy memberships to an overall forest class.
The notion of bounded difference underpins the fuzzy confusion matrix as follows: the minimum interval is used to calculate the fuzzy intersections between fuzzy sets of the same class and the bounded difference is used to determine all other fuzzy intersections (i.e. off-diagonals in the confusion matrix). The concepts and measures of fuzzy loss and gain, usually used in a time series analysis of change, can here be used to determine the areas of difference between the 2 classifications containing the 2 concepts of forest. These are derived from the marginal totals of a confusion matrix and describe the overlaps (intersections) and non-overlaps (non-intersections) between land cover classes defined in different ways. From these, estimates of the amount (area) of fuzzy intersection between each class can be obtained as well as the total amounts of non-intersection through fuzzy loss and gain.
3.4.1 Minimum interval
In a standard fuzzy sets approach, the minimum operator is used to determine the intersection between two fuzzy classifications, C1 and C2 as follows:
In the analyses below, this is used to determine the diagonal elements in the fuzzy correspondence matrices.
3.4.2 Bounded difference
The bounded difference describes the fuzzy intersection of 2 land cover types. It provides a conservative estimate of intersection and non-intersection because of its logic and mathematics: essentially if the sum of fuzzy memberships at any location is less than one then the membership to the intersection, i.e. fuzzy change (non-intersection), will be zero. The bounded difference between two fuzzy sets A and B is defined as follows:
3.4.3 Loss and gain
In the methods suggested by Fisher et al. (2006b), the bounded difference (Eq. 3) is used to quantify the off-diagonal loss and gain at each location (pixel) from the marginal totals of the fuzzy correspondence matrix.
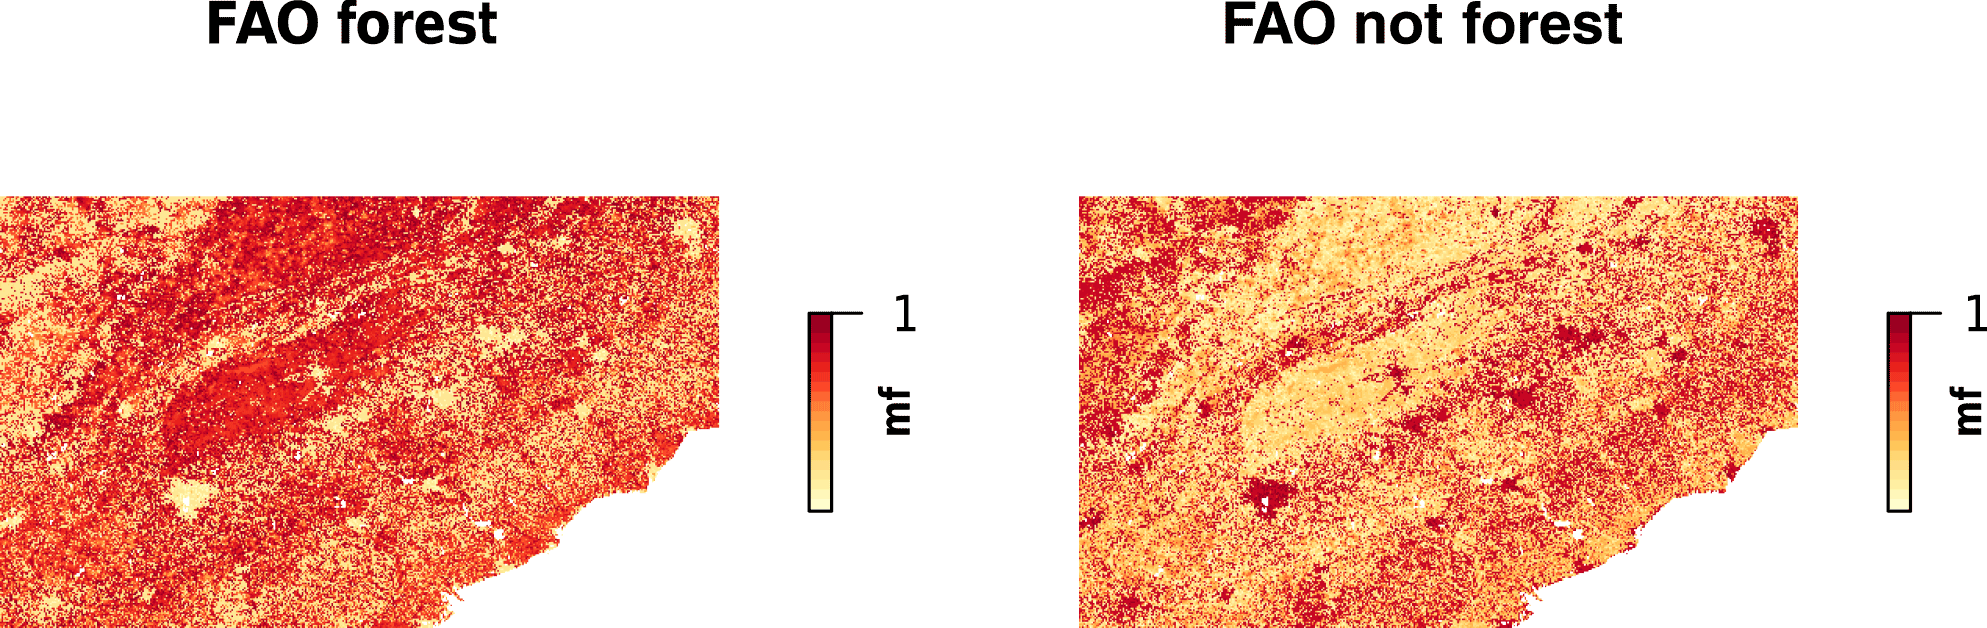
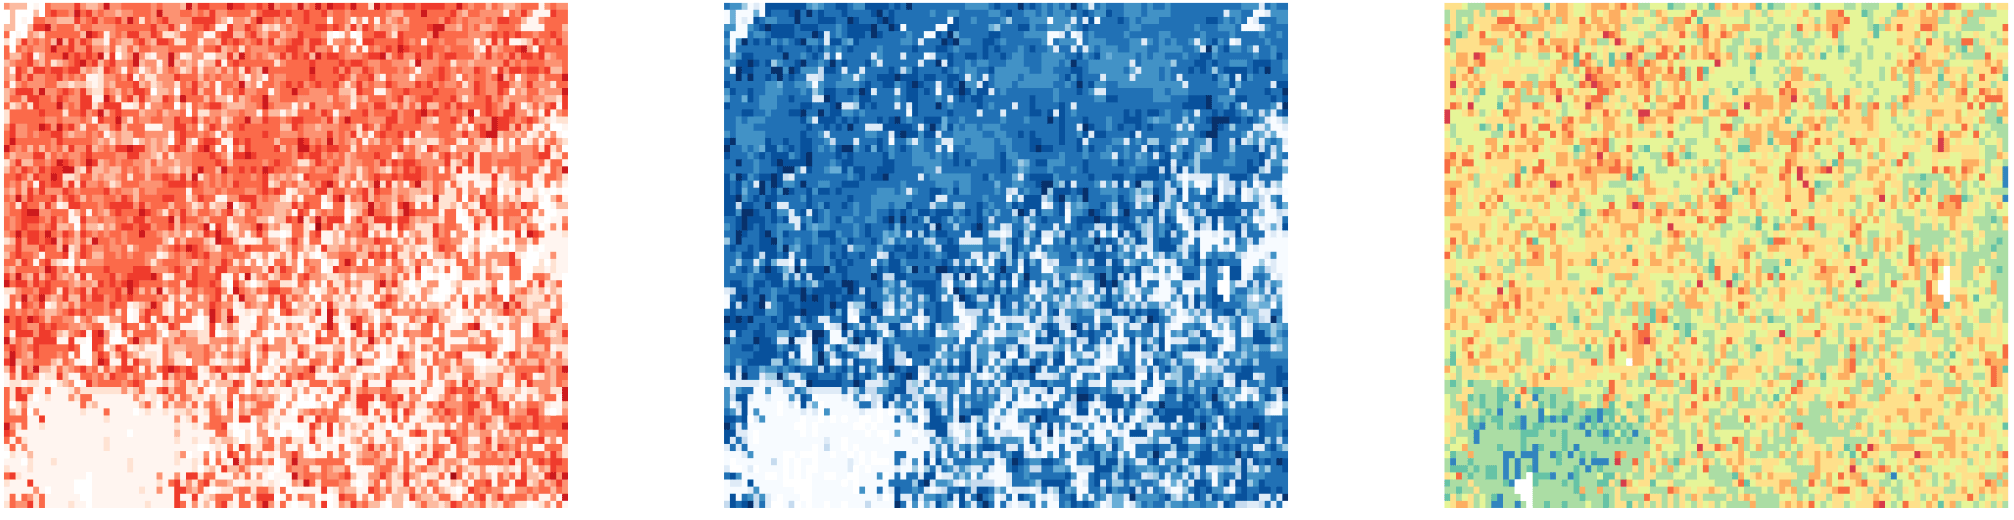
Figure 5Detail around Atlanta, Georgia of the differences in the fuzzy memberships to the GLC (red) and FAO (blue) forest classes, with a map of difference, yellow indicating similar fuzzy membership values, red where GLC fuzzy forest memberships are greater and blue where FAO are greater.
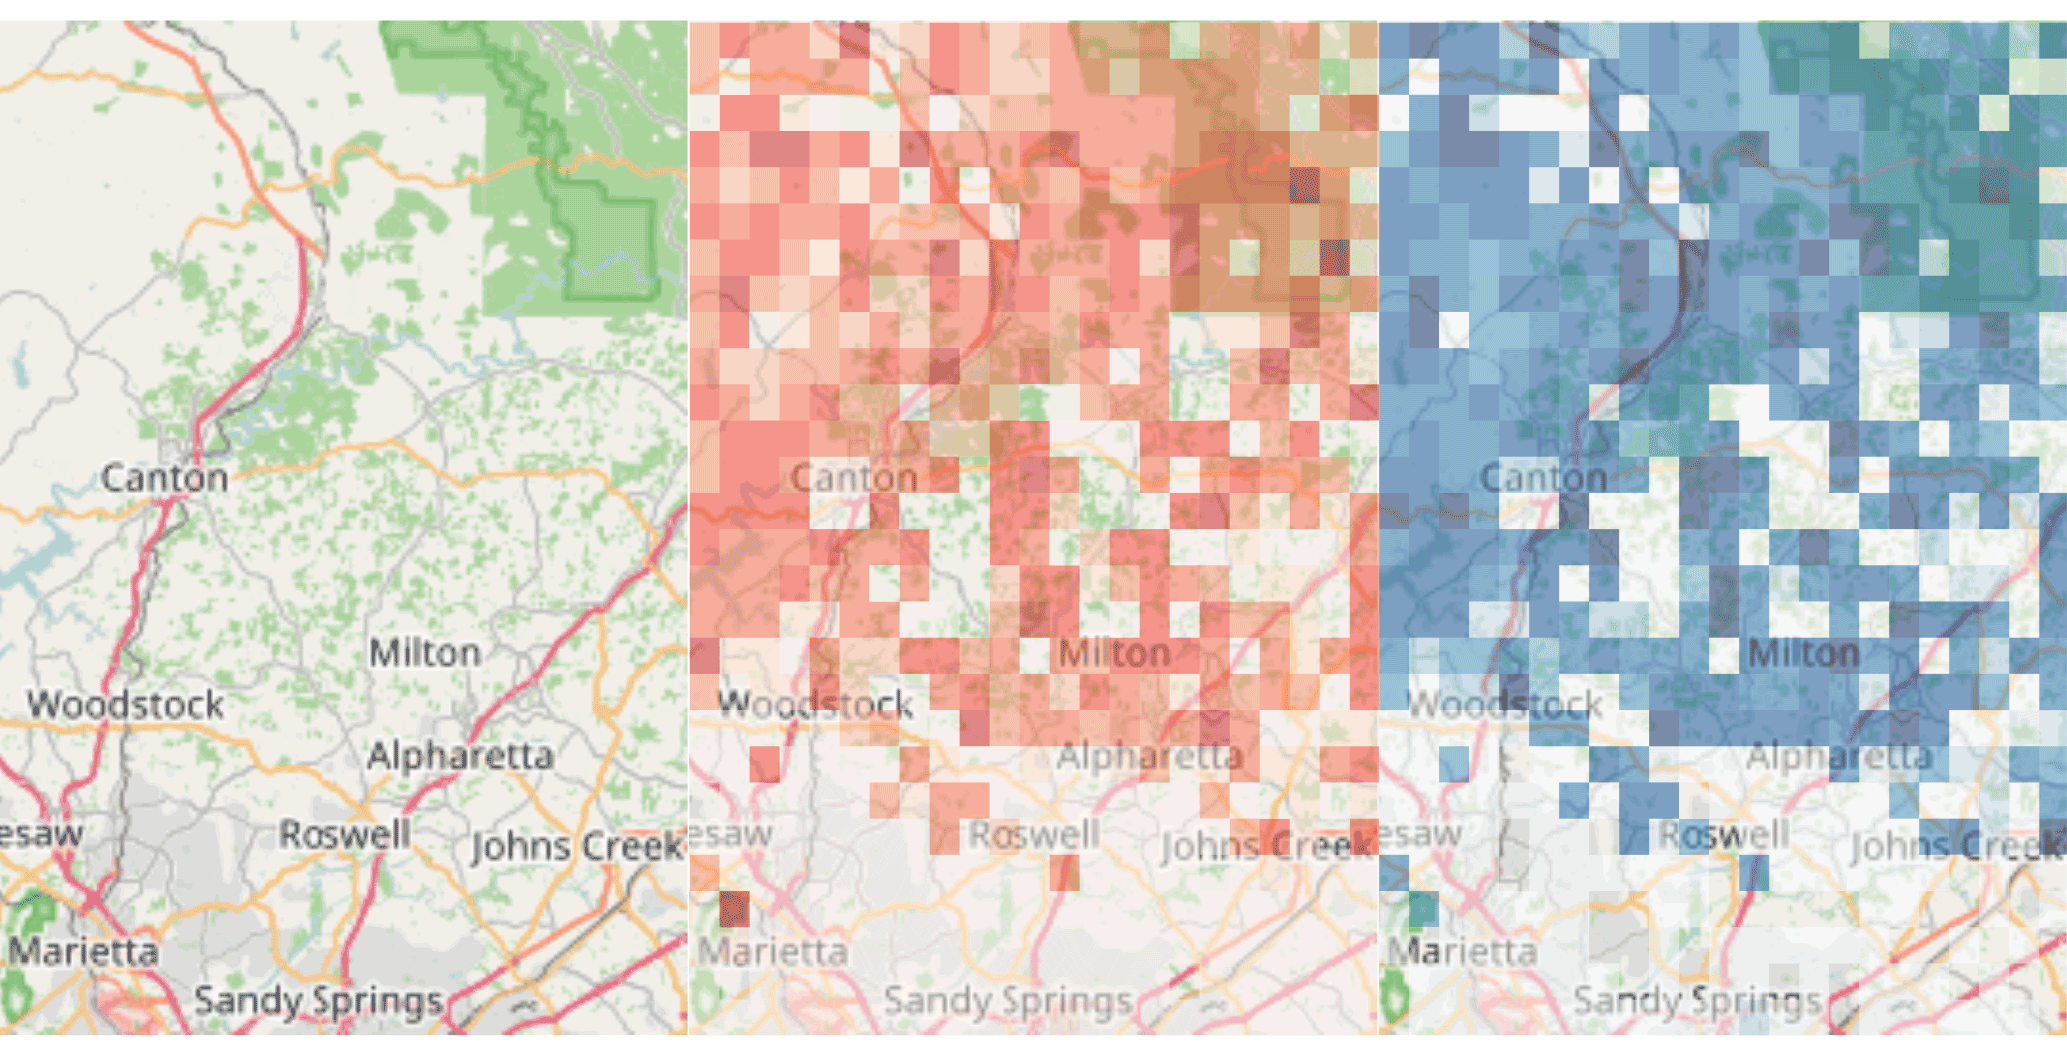
Figure 6The boundary conditions between forest and not-forest arising from the differently defined forest classes, with context from an Open Street Map backdrop. The fuzzy GLC forest is mapped in red and the FAO fuzzy forest class is mapped in blue, both with a transparency term.
3.4.4 Worked example
Consider two fuzzy classifications (C1 and C2) of three classes each (a, b and c) on a 4x4 pixel grid, as described in Tables 4 and 5. Each cell contains the memberships to three classes at each time interval.
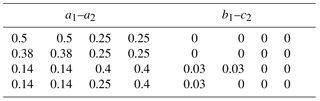
The diagonals in the fuzzy correspondence matrix are populated by the sum of the minimum intersections and the off diagonals by the sums of the bounded difference. To illustrate this, the table of minimum interval for class a in classes a1 and a2 is shown in Table 6, along with the bounded difference between classes b1 and c1. The derived fuzzy correspondence matrix is shown in Table 7.
4.1 Fuzzy forest
The fuzzy memberships to the three GLC forest classes, whose class centres are listed in Table 2 are shown in Fig. 3, along with a combined overall membership for all GLC forest classes. The class centres for the forest class arising from FAO class definition are shown in shown Table 3. The result of the fuzzy c-means classification is shown in Fig. 4.
4.2 Boundaries
Having generated the fuzzy classifications, the resulting boundaries between the two forest classes (GLC2000 and FAO) can now be compared. It is instructive to consider a sub-region in greater detail, in this case an area to the north and west of Atlanta, Georgia. Figure 5 shows the GLC-derived and FAO-derived fuzzy forest distributions in greater detail in Fig. 6. It is evident that the FAO membership values are greater in many places than the GLC memberships and this is reflected in the summary statistics in Table 8. Figure 5 shows that, broadly, the presence of forest is indicated in the same places (erroneously or not) by both definitions of forest, with varying degrees of membership, suggesting different intensities of forest. The detail in Fig. 6 illustrates the local variation in those membership intensities.
Table 6The minimum interval for class a (that is a1–a2) and the bounded difference between classes b1 and c1.
4.3 Fuzzy difference
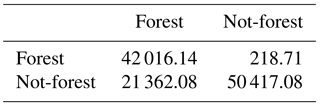
The classic approach to examining the intersection between two fuzzy sets is to use fuzzy bounded difference, with explanatory fuzzy losses and gains (as in Table 7). The losses and gains are evident in the off diagonals of the fuzzy bounded difference correspondence matrix. The data for per pixel fuzzy memberships for the FAO and GLC classifications of “forest” and “not-forest” were used as the inputs to the fuzzy difference analysis (Eq. 3). The results are shown in Table 9 and quantify the similarities and differences in the membership to the two classes of forest in this study. This provides a tractable and transparent method to move between two classifications, regardless of their semantics. The off diagonals in Table 9 provide the equivalent of the losses and gains, relative to the forest class under consideration and describe how the semantic boundaries between the two classes intersect.
Table 7The fuzzy difference matrix with loss and gain for the worked example.
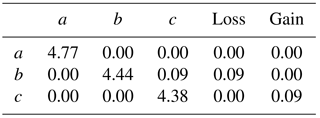
Table 8The summaries of the Fuzzy memberships GLC and FAO derived Forest classes.
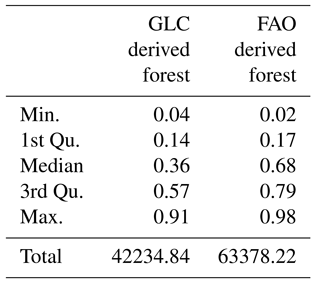
Table 9The fuzzy difference matrix for the GLC (rows) and FAO (columns) classifications of forest.
The REDD+ programme aims to reduce carbon emissions from deforestation and forest degradation. A key tenet of the programme is to financially reward less developed countries for their preservation (or increase) of forest stocks. However, any mapping, including land cover mapping, is only a representation of some view of reality (Comber et al., 2005) and different views of reality exist between and within different stakeholders and communities, whether they be citizens, scientists or involved in policy making (see Harvey and Chrisman, 1998 for the classic example of the negotiation of the differences in land cover definitions).
The problems for REDD+ are two-fold. First, differences in definitions of forest influence the amount of forest that is mapped, and therefore measures of carbon storage. This undermines the ambitions of REDD+. For example, Romijn et al. (2013) found that different definitions of forest resulted in different amounts of Indonesian deforestation being identified. They noted critically that any definition of forests that is not adapted to national circumstances could lead to large areas of deforestation being excluded and not accounted for under the REDD+ scheme, confusing the carbon accounting. Other research has identified similar problems in other areas (Van Noordwijk and Minang, 2009; Magdon et al., 2014; Gou, 2016). To better understand the implications and origins of this confusion, some research has sought to unpick forest classifications and how they relate to different management objectives (Chazdon et al., 2016). Although these authors do not refer to semantics, their study clearly shows how different forest semantics are driven by initiatives (such as the IPCC, biodiversity conventions, or agroforestry fora), noting that the presence of different management objectives provides a perspective from which specific definitions are created” (p. 539). Second, REDD+ forest mapping activities are being used to impose a specific view of the landscape, often at the expense of communities who live and work in forested areas (e.g. Bong et al., 2016). These communities, although key stakeholders, are frequently excluded and marginalized from the REDD+ mapping process, receiving little or none of the financial rewards, and often suffering from opportunistic land reforms arising on the back of REDD+. There is plenty of evidence of this situation in the literature from all over the world (e.g. Gizachew et al., 2017, Astuti and McGregor, 2017; Larson et al., 2013; Sunderlin et al., 2014; Lyster, 2011; Ezzine-de-Blas et al., 2011; Duchelle et al., 2014). A data primitive approach to mapping, linked to fuzzy sets, allows for varying (vague and ambiguous) interpretations of the concept of “forest” to be simultaneously represented and mapped as well as the landscape more generally. This approach allows the divergence and plurality of concepts of forest to be simultaneously accommodated within the mapping and measurement of forest. It is sensitive to and supports local semantics and landscape conceptualisations in spatial data and mapping, while at the same time allowing parallel external or standardised view of landscapes, such as are required for REDD+.
Further work will explore how such approaches can be used to link across divergent classification systems, to support methods for spatial data integration. It will also investigate the sensitivity of the methods and results to different fuzzy exponent values, which is the main factor that controls the degree of fuzziness or hardness in the outputs. There is also a need to look at the data on which the fuzzy classifier is trained – here medians were used – but the full distribution of values in different data primitive dimensions could be explored. There are also opportunities to consider how this approach could be further extended into considerations of fuzzy change for analysing temporal change between different (n) classifications with different classes – a sort of type-n fuzzy set problem. This would help to determine the directions of “forestness” transitions, for example to quantify the success of restoration or increasing carbon stocks with the stand age. Finally, there are opportunities to extend this approach to other approaches that generate beliefs such as those based on probabilities.
This paper has shown how data primitives and fuzzy intersections can be used to support alternative mappings of the same feature (in this case forest) based on different semantics and concepts. The methods allow the differences between stocks of forest to be quantified when different forest classifications are applied. The data primitive approach defines each forest class in terms of their positions in different dimensions: here measures of soil wetness, vegetation height, biomass, human disturbance and seasonality were used. These provide a common set of orthogonal data layers (GIS field layers) and are fully described in Comber (2008) and Wadsworth et al. (2008). Fuzzy intersection methods (Fisher et al., 2006b) were used to quantify the overlaps between the classes, specifically fuzzy bounded difference. Representing forest classifications using fuzzy sets allows the inherent uncertainty in the classification procedure to be represented as well as the inherent vagueness and ambiguity in forest definitions. Some of this may be due to image or pixel uncertainty but also to variations in the semantics and concepts of forest held by different groups and stakeholders in the REDD+ process. This method allows the plurality of forest definitions to be simultaneously represented in spatial data, whatever the local definition of forest is. Thus, different classifications, resulting from diverse conceptualizations of landscape features such as forest can be overcome, not through standardization (see Comber et al., 2007) as argued by many in the policy arena and the remote sensing community, but by accommodating divergent “soft”, fuzzy classifications and mappings. Crucially, such an approach to forest mapping does not rely on any boundaries, be they crisp or vague. It only requires the ability to characterize classes within the dimensions of the data primitives in the “forestness” vector field. The methods described in this paper could be used in the context of REDD+ initiatives to support multiple views of the same landscape. Such transparency can overcome some of the problems of exclusion and back door land reforms that are commonly experienced during REDD+ initiatives and mapping (Ezzine-de-Blas et al., 2011), as well as the issues highlighted by Romijn et al. (2013) of how to define forest. In our approach, one can define forest however one wants and link it to another definition.
All of the analyses and maps in this paper were undertaken in R, the open source statistics software. The code and data used to construct this analysis as well as the RMarkdown file used to create this paper are freely available at https://github.com/lexcomber/ForestPaper.
Some of the ideas in this work were developed under a Joint Nature
Conservancy Committee project “Fuzzy approaches for Developing and
Evaluating Earth Observation-enabled ecological land cover time series
system” (JNCC Reference: C12-0171-0589). The authors would like to thank
Ross Purves and his team for their invitation to take part in a workshop in 2016,
which led to the further development of these ideas. Lex Comber would like to
thank the late and great Pete Fisher for the germ of the ideas in this
paper: these were taken from work that he and Pete never managed to finish.
Werner Kuhn acknowledges support from the University of California, Santa
Barbara, for the Center of Spatial Studies.
Edited by: Benedikt Korf
Reviewed by: two anonymous referees
Ahlqvist, O.: A parameterized representation of uncertain conceptual spaces, T. GIS, 8, 493–514, 2004.
Angelsen, A. (Ed.): Realising REDD+: National strategy and policy options, Cifor, Situ Gede Bogor Barat, Indonesia, 2009.
Astuti, R. and McGregor, A.: Indigenous land claims or green grabs? Inclusions and exclusions within forest carbon politics in Indonesia, J. Peasant Stud., 44, 445–466, 2017.
Bartholome, E. and Belward, A. S.: GLC2000: A new approach to global land cover mapping from earth observation data, Int. J. Remote Sens., 26, 1959–1977, 2005.
Bennett, B.: What is a forest? On the vagueness of certain geographic concepts, Topoi, 20, 189–201, 2001.
Beymer-Farris, B. A. and Bassett, T. J.: The REDD menace: resurgent protectionism in Tanzania's mangrove forests, Global Environ. Change, 22, 332–341, 2012.
Bezdek, J. C.: Pattern Recognition with Fuzzy Objective Function Algorithms, Plenum Press, New York, 1981.
Bong, I. W., Felker, M. E., and Maryudi, A.: How Are Local People Driving and Affected by Forest Cover Change? Opportunities for Local Participation in REDD+ Measurement, Reporting and Verification, PloS One, 11, e0145330, https://doi.org/10.1371/journal.pone.0145330, 2016.
Burenhult, N.: Landscape terms and toponyms in Jahai: a field report, Working Pap. Linguist., 51, 17–29, 2009.
Burrough, P. A. and Frank, A. U. (Eds.): Geographic Objects with Indeterminate Boundaries, Taylor and Francis, London, 1996.
Cavanagh, C. and Benjaminsen, T. A.: Virtual nature, violent accumulation: the `spectacular failure' of carbon offsetting at a Ugandan National Park, Geoforum, 56, 55–65, 2014.
Cavanagh, C. J., Vedeld, P. O., and Trædal, L. T.: Securitizing REDD+? Problematizing the emerging illegal timber trade and forest carbon interface in East Africa, Geoforum, 60, 72–82, 2015.
Chazdon, R. L., Brancalion, P. H. S., Laestadius, L., Bennett-Curry, A., Buckingham, K., Kumar, C., Moll-Rocek, J., I. C. Guimaraes Vieira, and Wilson, S. J.: When is a forest a forest? Forest concepts and definitions in the era of forest and landscape restoration, Ambio, 45, 538–550, 2016.
Comber, A.: The separation of land cover from land use with data primitives, J. Land Use Sci., 3, 215–229, 2008.
Comber, A., Wadsworth, R. and Fisher, P.: Reasoning methods for handling uncertain information in land cover mapping, in: Fundamentals of Spatial Data Quality, edited by: Devillers, R., and Jeansoulin, R., ISTE, London, 123–139, 2006.
Comber, A. J., Fisher, P. F., and Wadsworth, R. A.: What is land cover?, Environ. Plan. B, 32, 199–209, 2005.
Comber, A. J., Fisher, P. F., and Wadsworth, R. A.: Land cover: to standardise or not to standardise? Comment on `Evolving standards in land cover characterization' by Herold et al., J. Land Use Sci., 2, 287–291, 2007.
Couclelis, H.: People manipulate objects (but cultivate fields): Beyond the raster-vector debate in GIS, in: Theories and methods of spatio-temporal reasoning in geographic space, edited by: Frank, A. U., Campari, I., and Formentini, U., Springer-Verlag, Berlin, 65–77, 1992.
Di Gregorio, A. and Jansen, L. J.: Land Cover Classification System (LCCS): classification concepts and user manual, FAO, Rome, 1998.
Duchelle, A. E., Cromberg, M., Gebara, M. F., Guerra, R., Melo, T., Larson, A., Cronkleton, P., Börner, J., Sills, E., Wunder, S., and Bauch, S.: Linking forest tenure reform, environmental compliance, and incentives: lessons from REDD+ initiatives in the Brazilian Amazon, World Development, 55, 53–67, 2014.
Ece, M.: Representation through Privatisation. Responsive Forest Governance Initiative, working paper 23 – available at: https://sdep.earth.illinois.edu/files/RFGI_Working_Papers/RFGI 23_Melis Ece.pdf (last access: 23 March 2017), 2015.
Ezzine-de-Blas, D., Börner, J., Violato-Espada, A. L., Nascimento, N., and Piketty, M. G.: Forest loss and management in land reform settlements: Implications for REDD governance in the Brazilian Amazon, Environ. Sci. Policy, 14, 188200, 2011.
Fisher, P., Comber, A., and Wadsworth, R.: Approaches to uncertainty in spatial data, in: Fundamentals of Spatial Data Quality, edited by: Devillers, R. and Jeansoulin, R., ISTE, London, 43–59, 2006a.
Fisher, P., Arnot, C., Wadsworth, R., and Wellens, J.: Detecting change in vague interpretations of landscapes, Ecol. Inform., 1, 163–178, 2006b.
Fisher, P., Cheng, T., and Wood, J.: Higher order vagueness in geographical information: empirical geographical population of type n fuzzy sets, Geoinformatica, 11, 311–330, 2007.
Fisher, P. F.: The pixel: a snare and a delusion, Int. J. Remote Sens., 18, 679–685, 1997.
Fisher, P. F.: Remote sensing of land cover classes as type 2 fuzzy sets, Remote Sens. Environ., 114, 309–321, 2010.
Fisher, P. F. and Pathirana, S.: The evaluation of fuzzy membership of land cover classes in the suburban zone, Remote Sens. Environ., 34, 121–132, 1990.
Fisher, P. F., Comber, A. J., and Wadsworth, R. A.: Land use and Land cover: Contradiction or Complement, in: Re-Presenting GIS, edited by: Fisher, P. and Unwin, D., Wiley, Chichester, 85–98, 2005.
Forest Peoples Programme: Annual Report, available at: http://www.forestpeoples.org/tags/annual-reports/publication/2015/annual-report-2014 (last access: 23 March 2017), 2014.
Gardenfors, P.: Conceptual Spaces: The Geometry of Thought. A Bradford Book, MIT Press, Cambridge, MA, 2000.
Gizachew, B., Astrup, R., Vedeld, P., Zahabu, E. M., andDuguma, L. A.: REDD+ in Africa: contexts and challenges, in: Natural Resources Forum, Blackwell Publishing Ltd., Berlin, 2017.
Gou, Y.: The Role of Maps in Capturing Distal Drivers of Deforestation and Degradation: A Case Study in Central Mozambique, in: Land Use Competition, Springer International Publishing, Berlin, 91–109, 2016.
Grainger, M. and Geary, K.: The New Forests Company and its Uganda plantations, OXFAM International, Washington, D.C., USA, 2011.
Gupta, A., Vijge, M. J., Turnhout, E., and Pistorius, T.: Making REDD+ transparent: The politics of measuring, reporting, and verification systems, in: Transparency in Global Environmental Goverance. Critical Perspectives , edited by: Gupta, A. and Mason, M., MIT Press (Earth System Goverance), Cambridge, Massachusetts, 181–201, 2014.
Harvey, F. and Chrisman, N.: Boundary objects and the social construction of GIS technology, Environ. Plan. A, 30, 1683–1694, 1998.
Herold, M., Verchot, L., Angelsen, A., Maniatis, D., and Bauch, S.: A Step-wise Framework for Setting REDD+ Forest Reference Emission Levels and Forest Reference Levels, CIFOR Infobrief, no. 52, Cifor, Situ Gede Bogor Barat, Indonesia, 2012a.
Herold, M., Angelsen, A., Verchot, L. V., Wijaya, A., and Ainembabazi, J. H.: A stepwise framework for developing REDD+ reference levels, in: Analysing REDD+; Challenges and Choices, edited by: Angelsen, A., Brockhaus, M., Sunderlin, W. D., and Sunderlin, L. V., CIFOR, Bogor, Indonesia, 279–299, 2012b.
Himmelfarb, D.: In the Aftermath of Displacement: A Political Ecology of Dispossession, Transformation, and Conflict on Mt. Elgon, Uganda, PhD Dissertation, University of Georgia, Athens, 2012.
Hoeschele, W.: Geographic information engineering and social ground truth in Attappadi, Kerala State, India, Ann. Assoc. Am. Geogr., 90, 293–321, 2000.
Klir, G. J. and Yuan, B.: Fuzzy Sets and Fuzzy Logic: Theory and Applications, Prentice Hall, Englewood Cliff., 1995.
Kuhn, W.: Geospatial semantics: why, of what, and how?, in: Journal on data s emantics III, Springer, Berlin, Heidelberg, 1–24, 2005.
Kuhn, W.: Core concepts of spatial information for transdisciplinary research, Int. J. Geogr. Inform. Sci., 26, 2267–2276, 2012.
Lakoff, G.: Women, fire, and dangerous things. What categories reveal about the mind, University of Chicago Press, Chicago, 1987.
Lakoff, G.: Women, fire, and dangerous things, University of Chicago Press, Chicago, 2008.
Larson, A. M., Brockhaus, M., Sunderlin, W. D., Duchelle, A., Babon, A., Dokken, T., Pham, T. T., Resosudarmo, I. A. P., Selaya, G., Awono, A., and Huynh, T. B.: Land tenure and REDD+: The good, the bad and the ugly, Global Environ. Change, 23, 678–689, 2013.
Leung, Y. C.: Spatial Analysis and Planning under Imprecision, Elsevier, New York, 1988.
Lund, H. G.: Definitions of Forest, Deforestation, Afforestation, and Reforestation, Misc. pagination, Forest Information Services, Gainesville, VA, Note, this paper has been continuously updated since 1998, https://doi.org/10.13140/RG.2.1.2364.9760, 2016.
Lyons, K. and Westoby, P.: Carbon colonialism and the new land grab: plantation forestry in Uganda and its livelihood impacts, J. Rural Stud., 36, 13–21, 2014.
Lyster, R.: REDD+, transparency, participation and resource rights: the role of law, Environ. Sci. Policy, 14, 118–126, 2011.
Magdon, P. and Kleinn, C.: Uncertainties of forest area estimates caused by the minimum crown cover criterion – a scale issue relevant to forest cover monitoring, Environ. Monit. Assess., 185, 5345–5360, 2012.
Magdon, P., Fischer, C., Fuchs, H., and Kleinn, C.: Translating criteria of international forest definitions into remote sensing image analysis, Remote Sens. Environ., 149, 252–262, 2014.
Meyer, D., Dimitriadou, E., Hornik, K., Weingessel, A., and Eisch, F.: e1071: Misc Functions of the Department of Statistics (e1071), R package version, TU Wien, Wien, 1–6, 2012.
Morales-Barquero, L., Skutsch, M., Jardel-Peláez, E. J., Ghilardi, A., Kleinn, C., and Healey, J. R.: Operationalizing the definition of forest degradation for REDD+, with application to Mexico, Forests, 5, 1653–1681, 2014.
Nel, A. and Hill, D.: Constructing walls of carbon–the complexities of community, carbon sequestration and protected areas in Uganda, J. Contemp. Afr. Stud., 31, 421–440, 2013.
Robbins, P.: Fixed categories in a portable landscape: the causes and consequences of land-cover categorization, Environ. Plan. A, 33, 161–179, 2001.
Romijn, E., Ainembabazi, J. H., Wijaya, A., Herold, M., Angelsen, A., Verchot, L., and Murdiyarso, D.: Exploring different forest definitions and their impact on developing REDD+ reference emission levels: A case study for Indonesia, Environ. Sci. Policy, 33, 246–259, 2013.
Ryan, C. M., Berry, N. J., and Joshi, N.: Quantifying the causes of deforestation and degradation and creating transparent REDD+ baselines: a method and case study from central Mozambique, Appl. Geogr., 53, 45–54, 2014.
Smith, B.: On drawing lines on a map, in: Lecture Notes in Computer Science 988 Spatial Information Theory, edited bb: Frank, A. U. and Kuhn, W., Springer, Berlin, 475–484, 1995.
Smith, B. and Mark, D.: Geographical categories: an ontological investigation, Int. J. Geogr. Inform. Sci., 15, 591–612, 2001.
Sunderlin, W. D., Larson, A. M., Duchelle, A. E., Resosudarmo, I. A. P., Huynh, T. B., Awono, A., and Dokken, T.: How are REDD+ proponents addressing tenure problems? Evidence from Brazil, Cameroon, Tanzania, Indonesia, and Vietnam, World Development, 55, 37–52, 2014.
UNFCCC COP15: Methodological guidance for activities relating to reducing emissions from deforestation and forest degradation and the role of conservation, sustainable management of forests and enhancement of forest carbon stocks in developing countries, Decision 4/CP.15, Copenhagen, http://unfccc.int/resource/docs/2012/sbsta/eng/l09r01.pdf (last access: 23 March 2018), 2009.
Van Noordwijk, M. and Minang, P.: If we cannot define it, we cannot save it: forest definitions and REDD, ASB Policy Brief 15, ASB Partnership for the Tropical Forest Margins, Nairobi, Kenya, http://www.asb.cgiar.org/content/if-we-cannot-define-it-we-cannot-save-it-forest-definitions (last access: 23 March 2018), 2009.
Wadsworth, R., Balzter, H., Gerard, F., George, C., Comber, A., and Fisher, P.: An environmental assessment of land cover and land use change in Central Siberia using Quantified Conceptual Overlaps to reconcile inconsistent data sets, J. Land Use Sci., 3, 251–264, 2008.
Zadeh, L. A.: Fuzzy sets, Inform. Control, 8, 338–353, 1965.
forestwith different meanings. Global forest inventories frequently ignore these conceptualizations. This paper describes an approach for generating alternative measures of forest simultaneously to support the international objectives of activities such as REDD+ and to reflect local concepts and semantics associated with
forest.