the Creative Commons Attribution 4.0 License.
the Creative Commons Attribution 4.0 License.
 | 23 Sep 2022
Shifting spatial patterns in German population trends: local-level hot and cold spots, 1990–2019
Tim Leibert
Manuel Wolff
Annegret Haase
The population development of German municipalities is characterized by pronounced regional disparities. We seek to shed new light on the shifting patterns of population development in Germany at the local level between 1990 and 2019 to understand better the drivers of population development at the local level and to initiate a debate on the (dis)advantages of longitudinal analyses of population change at the local level and the resulting methodological challenges. We address three interrelated questions: (1) how do patterns of local population trends shift over time and in space? (2) Where are the hot and cold spots of population development, and how stable are they? (3) Are there any persistent outliers defying the regional trends of population development? We use a unique database that includes annual data on the population development of all German municipalities to answer these questions. Using spatial autocorrelation and hot-spot–cold-spot analysis, we identify short- and long-term population trajectories that allow us to detect both the hot and the cold spots of population development and islands of growth in otherwise shrinking regions and islands of decline in growing regions. Stable hot spots of population growth exist around Germany's three largest cities – Berlin, Hamburg and Munich – and in the rural northwest. The cold spots of population development are concentrated in rural regions of eastern Germany but also structurally weak, old industrialized rural regions around Brunswick and Kassel and in Upper Franconia, Saarland and Western Palatinate.
- Article
(27157 KB) - Full-text XML
-
Supplement
(2306 KB) - BibTeX
- EndNote


The population development of German municipalities is characterized by pronounced regional disparities. We have witnessed population growth in most large cities and their suburban hinterlands and shrinkage in structurally weak rural areas in recent years (Wolff et al., 2022). Local trends of population development have shifted over time and in intensity and continue to develop and change (Wolff et al., 2020). A localized approach is necessary that accounts for the persistence of the corresponding patterns over time and detects important phenomena, such as islands of growth and decline, to understand the processes and drivers of these shifting patterns of growth and shrinkage better. Detecting these patterns is a necessary precondition for understanding why some local authorities defy the regional trends and patterns of population development and others do not. These phenomena cannot be assessed sufficiently at the level of districts and especially federal states (Madelin et al., 2009) because significant small-scale differences within regions might be masked. We seek to shed new light on the shifting patterns of population development in Germany at the local level between 1990 and 2019 to understand the associated drivers of population development better. We also aim to initiate a debate on the (dis)advantages of longitudinal analyses of population change at the local level and the resulting methodological challenges. We address the following research questions:
-
How do patterns of local population trends shift over time and in space?
-
Where are the hot and cold spots of population development, and how stable are they?
-
Are there any persistent outliers defying the regional trends of population development?
Detecting these patterns and their shifts over time involves two challenges: firstly, the choice of a spatial level of analysis has an impact on the conclusions drawn. This is discussed in the literature as the modifiable areal unit problem (MAUP), the statistical problem that the size of spatial units at different levels of aggregation can influence the results of quantitative analyses. The MAUP emerges when spatial units of different sizes and shapes are compared (Duque et al., 2018; Madelin et al., 2009). This results in scale effects because the spatial resolution acts as a filter of observation. Some authors advocate using fine-grain spatial levels so as to not overlook any relevant socioeconomic processes (Huby et al., 2009). Others point out that finer spatial scales might be impractical to use and hard to interpret (ESPON, 2006). Apart from the MAUP, the longitudinal analysis of interregional differentiation at the local level is connected to multiple other challenges and problems, for example, the effects of administrative reforms.
A second challenge is how to explain and interpret the regional patterns of population change. The intraregional differentiation in population development is the result of a complex interplay of demographic, economic, institutional and societal factors (Hoekveld, 2015) with numerous interdependencies and feedback loops. This paper is limited to the presentation and initial interpretation of the spatial patterns of population development at the local level. An in-depth interpretation or (statistical) explanation, although very relevant, would clearly go beyond the scope of this paper.
We analyze a unique database in our paper that includes annual data on the population development of all German municipalities between 1990 and 2019. We identify short- and long-term population trajectories using spatial autocorrelation and hot- and cold-spot analysis. This approach allows us to detect islands of growth in otherwise shrinking regions and islands of decline in growing regions. To the best of our knowledge, no such analysis has been carried out for Germany before. The paper is structured as follows: we briefly describe the drivers of population change and the patterns and trends of population development in Germany since reunification in Sect. 2. Section 3 describes our analytical approach and data sources. Section 4 presents the results of our analyses of local-level population trends. We finish the paper with a discussion and concluding remarks.
2.1 Persistent patterns of population development in Germany
The population and spatial structure in the capitalist Federal Republic of Germany (FRG) and the socialist German Democratic Republic (GDR) developed differently prior to 1989 (Rösel, 2019). There are different positions in the literature regarding how far back in time the differences in population development in eastern and western Germany go. According to Rösel (2019:23), eastern and western Germany developed “completely in the same way” between 1871 and 1949. Klüsener and Zagheni (2014), on the other hand, assume that population growth in eastern Germany has been below average since the end of the 19th century. The negative effects of the German division and the massive economic problems after reunification affecting the demographic situation in eastern Germany are, however, undisputed (Klüsener and Zagheni, 2014; Rösel, 2019). The German division and European integration have also influenced the population development in the FRG, with the focus of population growth shifting to the south and the west (Klüsener and Zagheni, 2014). Figure 1 shows the differences between economically booming areas in the south and stagnating or shrinking regions in the north and west in the 1970s and 1980s, as well as the suburbanization around the big cities. In the GDR, the old industrialized regions in the southern part of the country lost population to newly developing industrial cities in the north. Reunification on 3 October 1990 marked a demographic and economic turning point in eastern Germany. The first half of the 1990s was characterized by a brief but intensive suburbanization wave and massive out-migration to western Germany (Slupina et al., 2016).
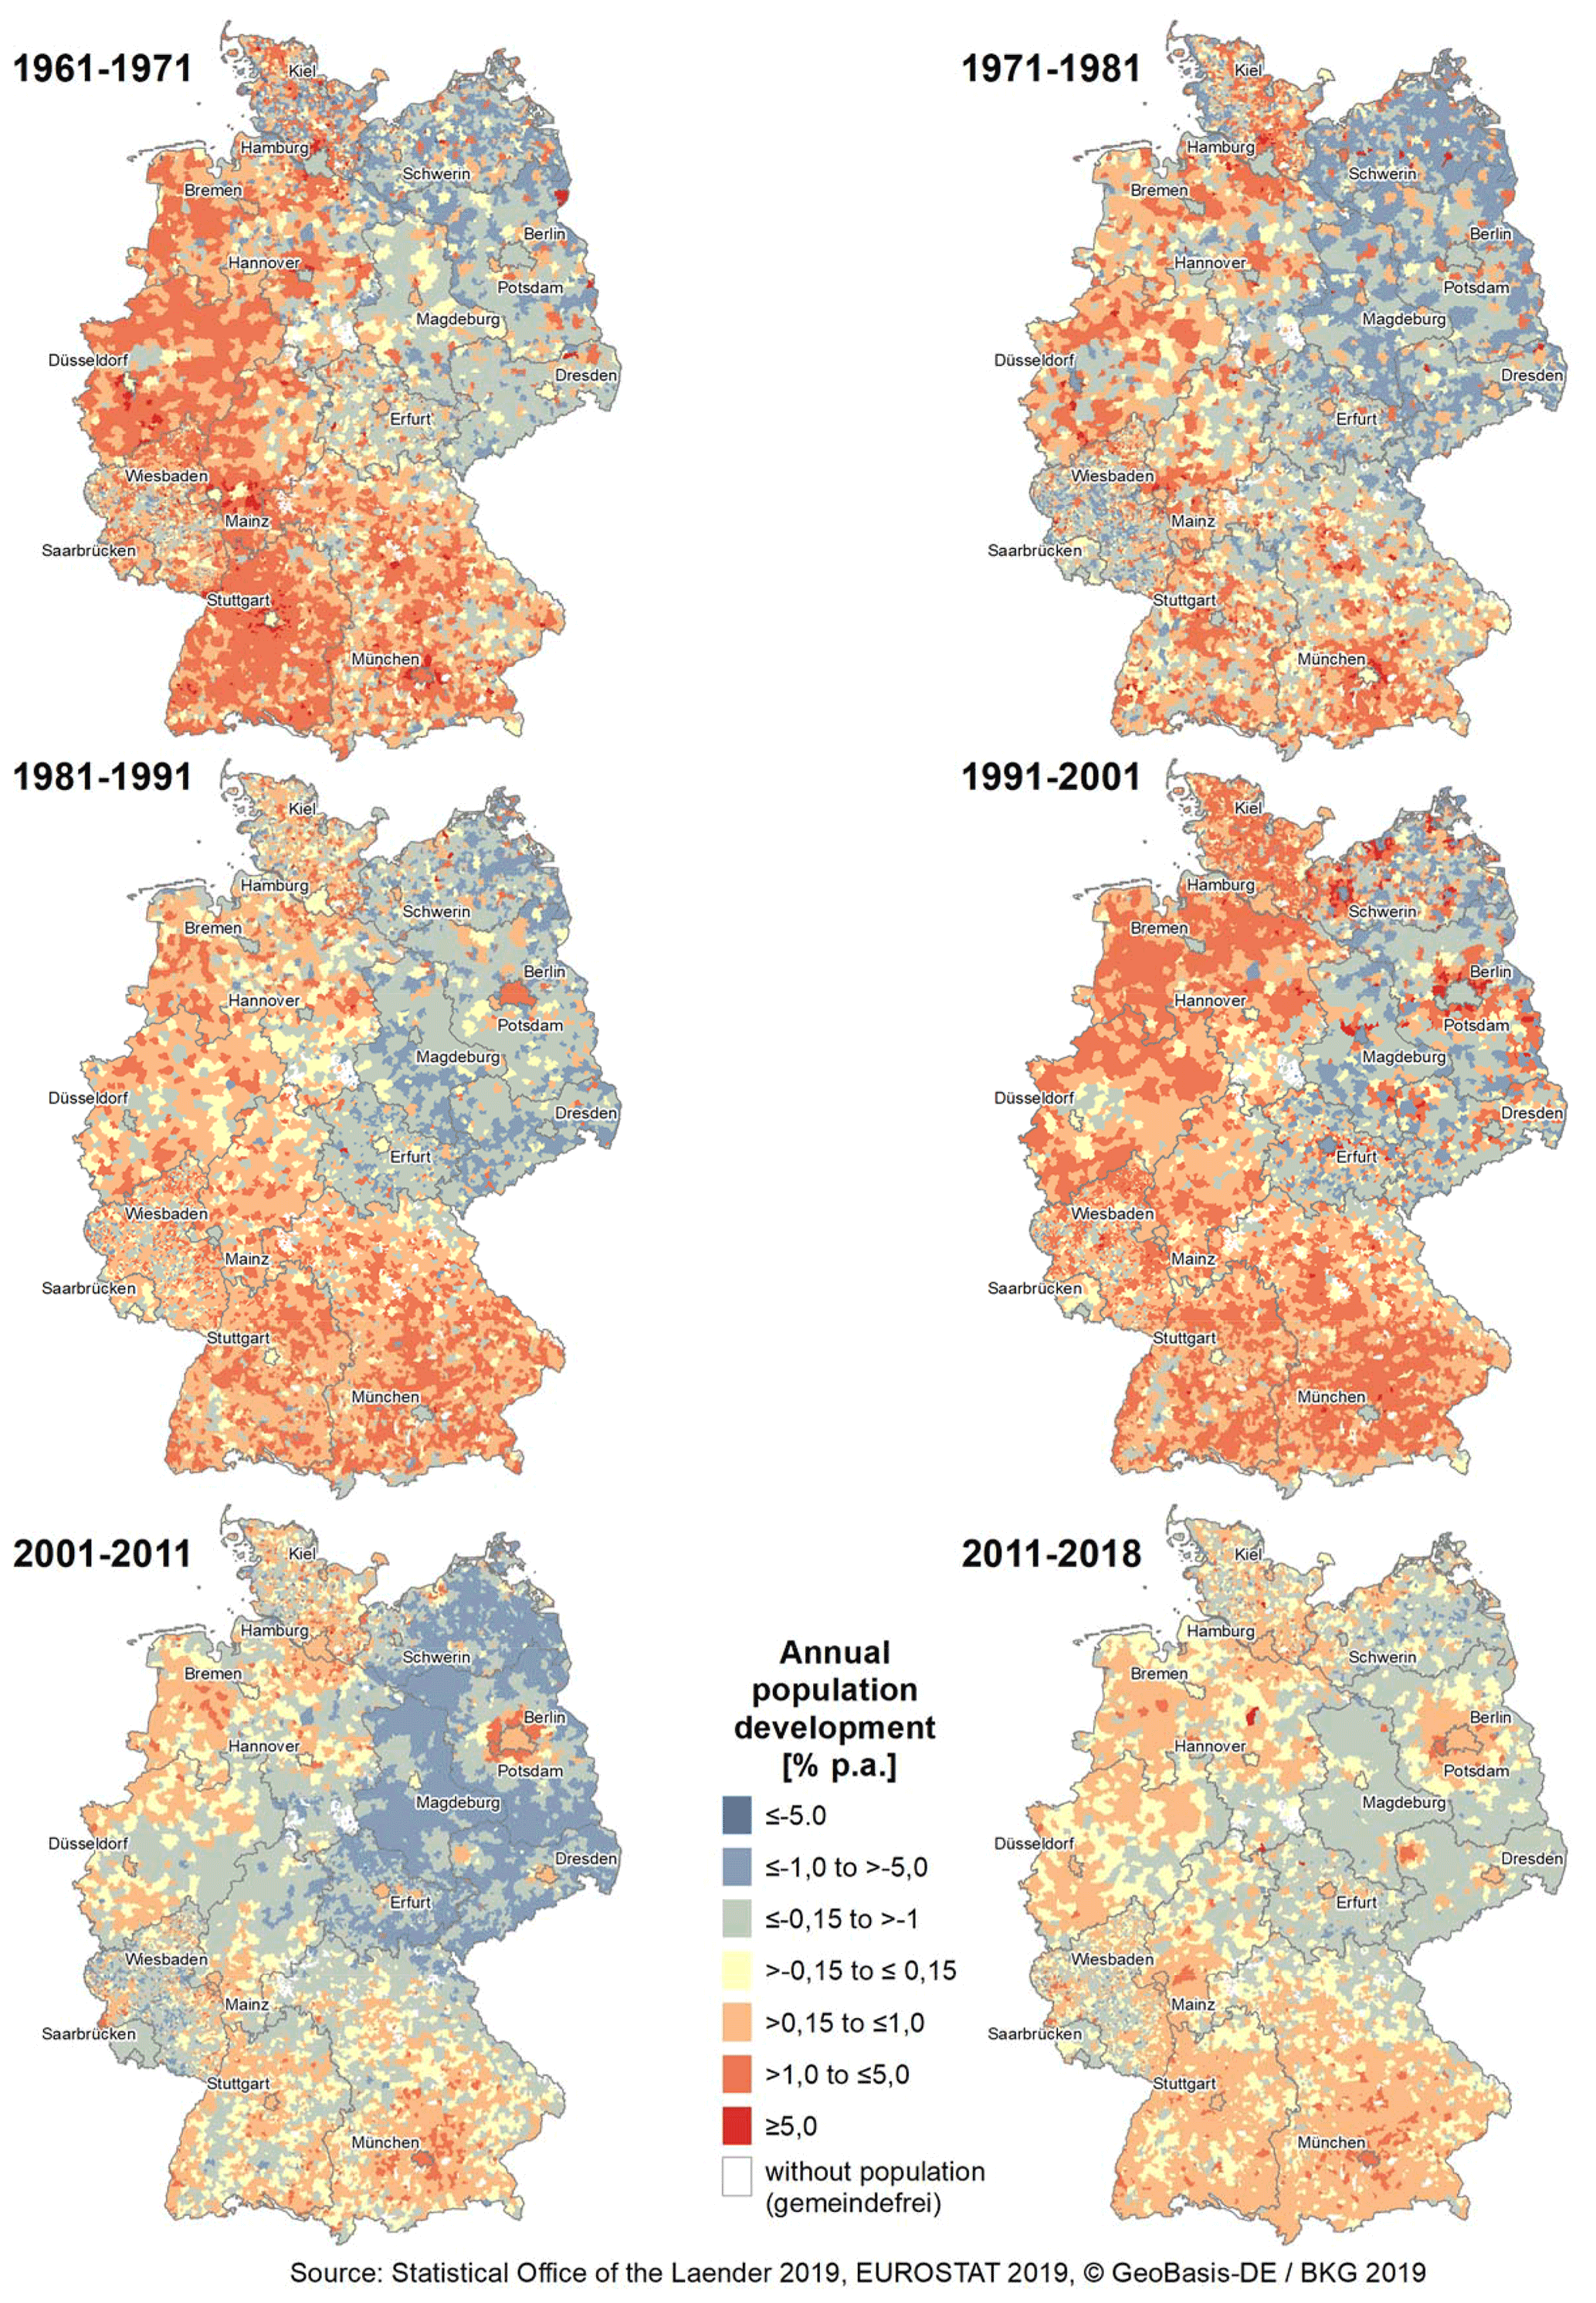
Figure 1Annual population development in municipalities 1961 to 2018. Source: Wolff et al. (2020).
Two characteristic drivers have shaped population and spatial development since the 2000s. Numerous major cities in both eastern and western Germany have experienced new population growth (Herfert and Osterhage, 2012, and Sect. 2.2). In eastern Germany, this process is linked to a (temporary) end of suburbanization (Nuissl and Rink, 2005). In the west, suburbanization has continued during this period, especially in growing agglomerations (Herfert and Osterhage, 2012). Suburbanization has gained momentum again in prosperous regions in recent years (Osterhage, 2018). In contrast to the growth in large cities and urban regions, population numbers have declined in rural areas characterized by permanent structural weaknesses in both small rural settlements and small towns (Fink et al., 2019), not only in eastern Germany but also in regions such as northern Hesse, Upper Franconia or Saarland (see Fig. 1). The picture changed again towards the end of the 2010s with the trend reversal in migration between eastern and western Germany. Since 2017, the migration balance of eastern Germany with the west has been positive for the first time since reunification (Stawarz et al., 2020) and the previously clear division between growth in the west and shrinkage in the east has been attenuated. This is not to say that shrinkage is no longer a problem. Population decline is still widespread, but the magnitude of losses has decreased (see Fig. 1).
2.2 From reurbanization to a “boom of urban regions”
The growth of large cities has led to the development of strong urban regions since the beginning of the 2000s. The population growth has increased in those western German cities that have been growing for a longer period of time. Even the population of many previously shrinking cities in the Ruhr area has increased slightly since 2011 (see Figs. 1 and 2). However, the socioeconomic problems of this region, such as high rates of unemployment, poverty and integration challenges, have not diminished (Fink et al., 2019). A trend reversal towards renewed growth has taken place in numerous previously shrinking eastern German cities. However, there are also structurally weak cities with stagnating or still-declining populations. Compared to the 2000s, Wolff et al. (2020) identify three main differences in current urban development trends: the increase in population is characterized no longer primarily by the in-migration of young adults but increasingly also by families, young professionals and younger wage earners (Osterhage, 2018). Urban growth is increasingly spreading to medium-sized cities and small towns in shrinking regions and structurally weak areas (Steinführer and Kohring, 2019).

Figure 2Interplay of demographic components for the population development in Germany 1990 to 2019. Source: Wolff et al. (2022).
This trend is referred to in the literature as reurbanization – a phenomenon with many facets. Not only are different definitions and operationalizations proposed, but there are also different positions on the causes of reurbanization (Haase et al., 2010; Osterhage, 2018; Siedentop, 2018). A first strand of literature focuses on socioeconomic changes, for example, the transition from Fordism to post-Fordism (Siedentop, 2018) or the increasing importance of the knowledge economy (Gans, 2015). The reconcentration of population in cities went hand in hand with a new attractiveness of urban life and living, especially for families (Frank, 2013). A second strand of literature focuses on demographic explanations, especially the selective migration of young adults and international migrants to large cities (Haase et al., 2010; Siedentop, 2018). Immigration is one of the main drivers of reurbanization, overcompensating for the out-migration of Germans in many cities and reinforcing spatial disparities of population change (Heider et al., 2020). However, the spatial preferences of migrants have changed significantly in recent years. Classical destination areas, for example, the Rhine-Ruhr area and the southwest, have lost their attractiveness. At the same time, new – predominantly rural – migration destinations have appeared on the map of international migrants, for example, the Weser-Ems region or Lower Bavaria, growing, economically strong regions but with rather low shares of immigrants (Tanis, 2020). This development suggests that the link between international migration and reurbanization might weaken in the future. Moreover, reurbanization is not automatically synonymous with growth in the core city (Gans, 2015). A special type of reurbanization can be observed in shrinking regions: the core city loses population – albeit to a lesser extent than the suburbs. Reurbanization has not affected all major German cities. Some western German industrial cities (e.g., Bremerhaven, Duisburg, Saarbrücken) were initially unable to benefit from the “boom of the cities” (Gans, 2015).
The reurbanization trend is associated with convergences, divergences and trend reversals. This is particularly evident in changing trends in migration behavior, which have led to a weakening of demographic aging in the major cities. The average age of residents in the urban districts increased from 40.8 to 42.6 years between 1995 and 2016. Since the end of the 2010s, the average age has remained stable or even fallen slightly. The reason for this is primarily the influx of young adults. However, the aging trend continues unabated in rural areas. Between 1995 and 2016, the median age of the rural population rose from 39.6 to 45 years. Since 2005, the average age of urban residents has been lower than that of the rural population (Henger and Oberst, 2019). The natural population development in many large cities has been positive in recent years (Fig. 2) as a result of the in-migration of younger population groups and a relatively high share of women of childbearing age. The positive natural population development in the metropolitan regions of Munich, Stuttgart and Frankfurt (Main), which has been strengthened by migration gains, also radiates to the suburban areas. Rural regions with positive natural and migration balances outside urban agglomerations can only be found in Upper Swabia and the Oldenburg Münsterland (Leibert, 2019; Wolff et al., 2021). However, urban growth in Germany has been slowing down since 2017. The COVID-19 pandemic may have accelerated this trend as immigration from abroad and the influx of students and young professionals has decreased. University cities, such as Heidelberg, Jena or Trier, are particularly affected. Long-shrinking, structurally weak cities, especially in the Ruhr region, on the other hand, are currently recording migration gains (Wolff et al., 2021). It is, however, still too early to say with certainty whether this is indeed a trend reversal or just a short-term episode.
Table 1Key data on municipalities by state 2019–2020. Source: StÄBL (2022), authors' calculations.

a On 30 June 2021. b On 31 December 2019. c Including unincorporated areas. d Including two inhabited unincorporated areas.
2.3 Consolidation of demographic processes in structurally weak regions
The changes in the migration patterns of German citizens and the increased attractiveness of Germany as a destination for international migrants in the 2010s are important explanations for another divergence in the patterns of population change in recent years: the deceleration of shrinkage in many rural areas (see Fig. 1). The interaction between the migration balance and the natural balance is of crucial importance for the population development of structurally weak regions (Fig. 2). From a demographic perspective, the main reasons for the continued decline in population are negative natural population change, selective out-migration (especially of young adults and potential parents) and unfavorable population structures. Selective out-migration leads to self-reinforcing downward spirals of shrinkage (Weber and Fischer, 2012). The pronounced out-migration of young adults in general and young women in particular (Leibert, 2016) leads to dynamic aging and increases the probability of above-average death rates and future population losses (Slupina et al., 2016). The change in the age structure takes place slowly and is, at best, weakened by immigration (Weber, 2015). To put it bluntly, the aging of today is the shrinkage of tomorrow.
Rural decline in the German discourse is often closely connected to sparsely populated rural areas in eastern Germany. There are also, of course, regions in the west with unfavorable population structures and steady population losses, for example, in Upper Franconia or the south of Lower Saxony. This structural shrinkage has been weakened or even counterbalanced by the allocation of refugees in recent years (Leibert, 2019). In view of the unclear prospects and wishes of the refugees to stay, it is likely that this is not a trend reversal but rather a temporary “demographic respite”. There are also, on the other hand, economically prosperous rural areas with growing populations. The key success factor seems to be a favorable location and/or good accessibility to larger cities or agglomerations (Born, 2011; Hoekveld, 2015). These areas benefit from the development of metropolitan areas, for example, by absorbing the increasing need for space for housing and commercial developments.
3.1 Spatial heterogeneity of Germany
As of 31 March 2022, the FRG consists of 16 federal states (NUTS1); 400 districts (NUTS3); 10 789 municipalities; and 209 unincorporated areas (LAU2), 207 of which are uninhabited (StÄBL, 2022). German municipalities vary significantly in population size in the different federal states partly as a result of dissimilar principles and strategies of the administrative reforms implemented since the 1970s (see Table 1). The considerable differences in the population size of municipalities pose a challenge for research because of the MAUP. This problem can be mitigated by using the 4605 Gemeindeverbände (associations of local authorities, former LAU1 level), which are more comparable in population size (see Table 1). The downside of using these larger units as a level of analysis is a loss of spatial detail, especially in rural areas. As a result, important information about specific demographic and regional planning challenges in smaller communities may be lost.
A second challenge concerns the effects of local administrative reforms. The number of municipalities on 31 December 1990 was 16 109 (Destatis, 1992) and, therefore, has reduced by one-third in the last 3 decades. Between 2000 and 2018, the number of municipalities in eastern Germany declined by more than 50 %. In western Germany, the number of local authorities decreased by only 1.5 % (Popp, 2018). While the administrative structure in most of the “old” federal states has been relatively stable over time, analyzing population development at the level of municipalities in eastern Germany requires a lot of effort to harmonize “historical” population numbers with the current territory.
A third challenge is the “problem of small numbers” (see Leibert, 2021). One normally uses relative values, such as population change in percent, to compare municipalities of different sizes. This solution is rather robust if the local authorities under study are not too small. However, relative values can also be misleading, especially when it comes to municipalities with fewer than 100 inhabitants, which still exist in Rhineland-Palatinate and Schleswig-Holstein. There are three mutually compatible strategies when dealing with small population numbers: temporal aggregation through longer periods of analysis; spatial aggregation through the combination of several spatial units; and methodological simplification, i.e., using indicators or methods which are more robust in dealing with outliers (Leibert, 2021). The three strategies each have the disadvantage that they are associated with considerable loss of information. Regarding temporal aggregation, there is a risk of blurring trend reversals. Spatial aggregation (e.g., using Gemeindeverbände instead of municipalities) harbors the risk that local characteristics, for example, different demographic trends in small towns and the surrounding villages, cannot be adequately considered. We have opted for the third strategy to avoid the loss of temporal and spatial information. Naturally, methodological simplification also has disadvantages: a loss of the rich quantitative information on the magnitude of the growth and decline. We have calculated our analyses at both the municipality level and the LAU1 level.
3.2 Data and analytical strategy
In a first step, we have collected population numbers from different sources. We use frozen municipal boundaries as of 30 June 2020 (BKG, 2020) to eliminate the effect of boundary changes on the rate of population change and recalculated all data accordingly to ensure comparability over time. Some federal states (Baden-Württemberg, Bavaria, Berlin, Brandenburg, North Rhine-Westphalia, Lower Saxony, Saxony) publish area-adjusted data for the entire period under consideration in their online databases. The statistical offices of Rhineland-Palatinate and Thuringia provided us with the population figures on request. We combined various data sources (national and regional databases, statistical reports, municipal directories) for the remaining states. Due to the diversity of data sources, it was unfortunately not possible to collect additional data (e.g., age structure, migration balance, natural balance) for the entire period of 1990–2019. We had to aggregate some municipalities in Mecklenburg-Western Pomerania, Rhineland-Palatinate, Schleswig-Holstein and Thuringia due to partial breakups of municipalities (Teilausgliederungen). This results in 10 776 LAU1 and 4604 LAU2 units for analysis. We calculated the annual (reference date 31 December) population growth rates for each municipality and Gemeindeverband between 1990 and 2019 following Eq. (1):
In a second step, we applied a hot- and cold-spot analysis using local G* statistics (Ord and Getis, 1995), as implemented in ArcGIS (ESRI, 2020). The motivation is to detect patterns of population change which form large-scale regional clusters. Thereby, significant spatial clusters for each annual population change rate between 1990 and 2019 have been detected, which indicate whether the spatial clustering of high or low values observed is more pronounced than one would expect in a random distribution of those same values. A high value (e.g., high population growth rate) and a small significance level for a municipality indicates spatial clustering of high values (hot spot). A low negative value and small significance level indicates spatial clustering of low values (cold spot). The tool reports results for a statistical significance with confidence levels of 90 %, 95 % and 99 %. As there are no pre-assumptions applied to this modeling strategy (e.g., weighting or critical thresholds of distances), we used the fixed-distance-band method to conceptualize spatial relationships (default setting) because it ensures that each feature has at least one neighbor. An applied sensitivity analysis has shown that the fixed-distance-band method provides the most differentiated spatial picture, allowing all spatial clusters of both the hot- and the cold-spot analysis to appear. This method allows the best-fitting interpretation of traditional mappings of population change rates, is a good option for polygon data when there is a large variation in polygon size ensuring a consistent scale of analysis, and does not apply a deterministic assumption about neighborhood relationships or distances (Chew et al., 2020; Kim and Choi, 2017; Sanchez-Cuervo and Aide, 2013; Sánchez-Martín et al., 2019).
In a third step, we detected spatial anomalies within the large-scale regional clusters identified, for example, municipalities which show a different population trend compared to their regional pattern. Based on the hot- and cold-spot analysis, we applied a cluster and outlier analysis for each annual population change rate based on a 95 % confidence level, which we consider a compromise between statistical robustness and ensuring a certain variation in spatial patterns. This method identifies statistically significant hot spots, cold spots and spatial outliers using Anselin's local Moran's I statistic (ESRI, 2020). We used the same conceptualization of spatial relationships for the hot- and cold-spot analysis. Spatial outliers are indicated by either municipalities with high values and that are surrounded by low values (high–low) or those with low values surrounded by high values (low–high). Finally, we defined islands of growth as units with an annual population change of >0.15 % belonging to a high–low cluster and islands of shrinkage as units with an annual population change of % belonging to a low–high cluster. We chose these thresholds because they are commonly used in comparable population studies (Guérois et al., 2019; Wolff and Wiechmann, 2018). We counted the frequency of a unit belonging to a hot spot, cold spot, island of growth or island of shrinkage (see Figs. 3 and 4) to provide a synthesis picture for the whole period of 1990 to 2019. This approach allows the dynamics of hot and cold spots to be traced over time.1
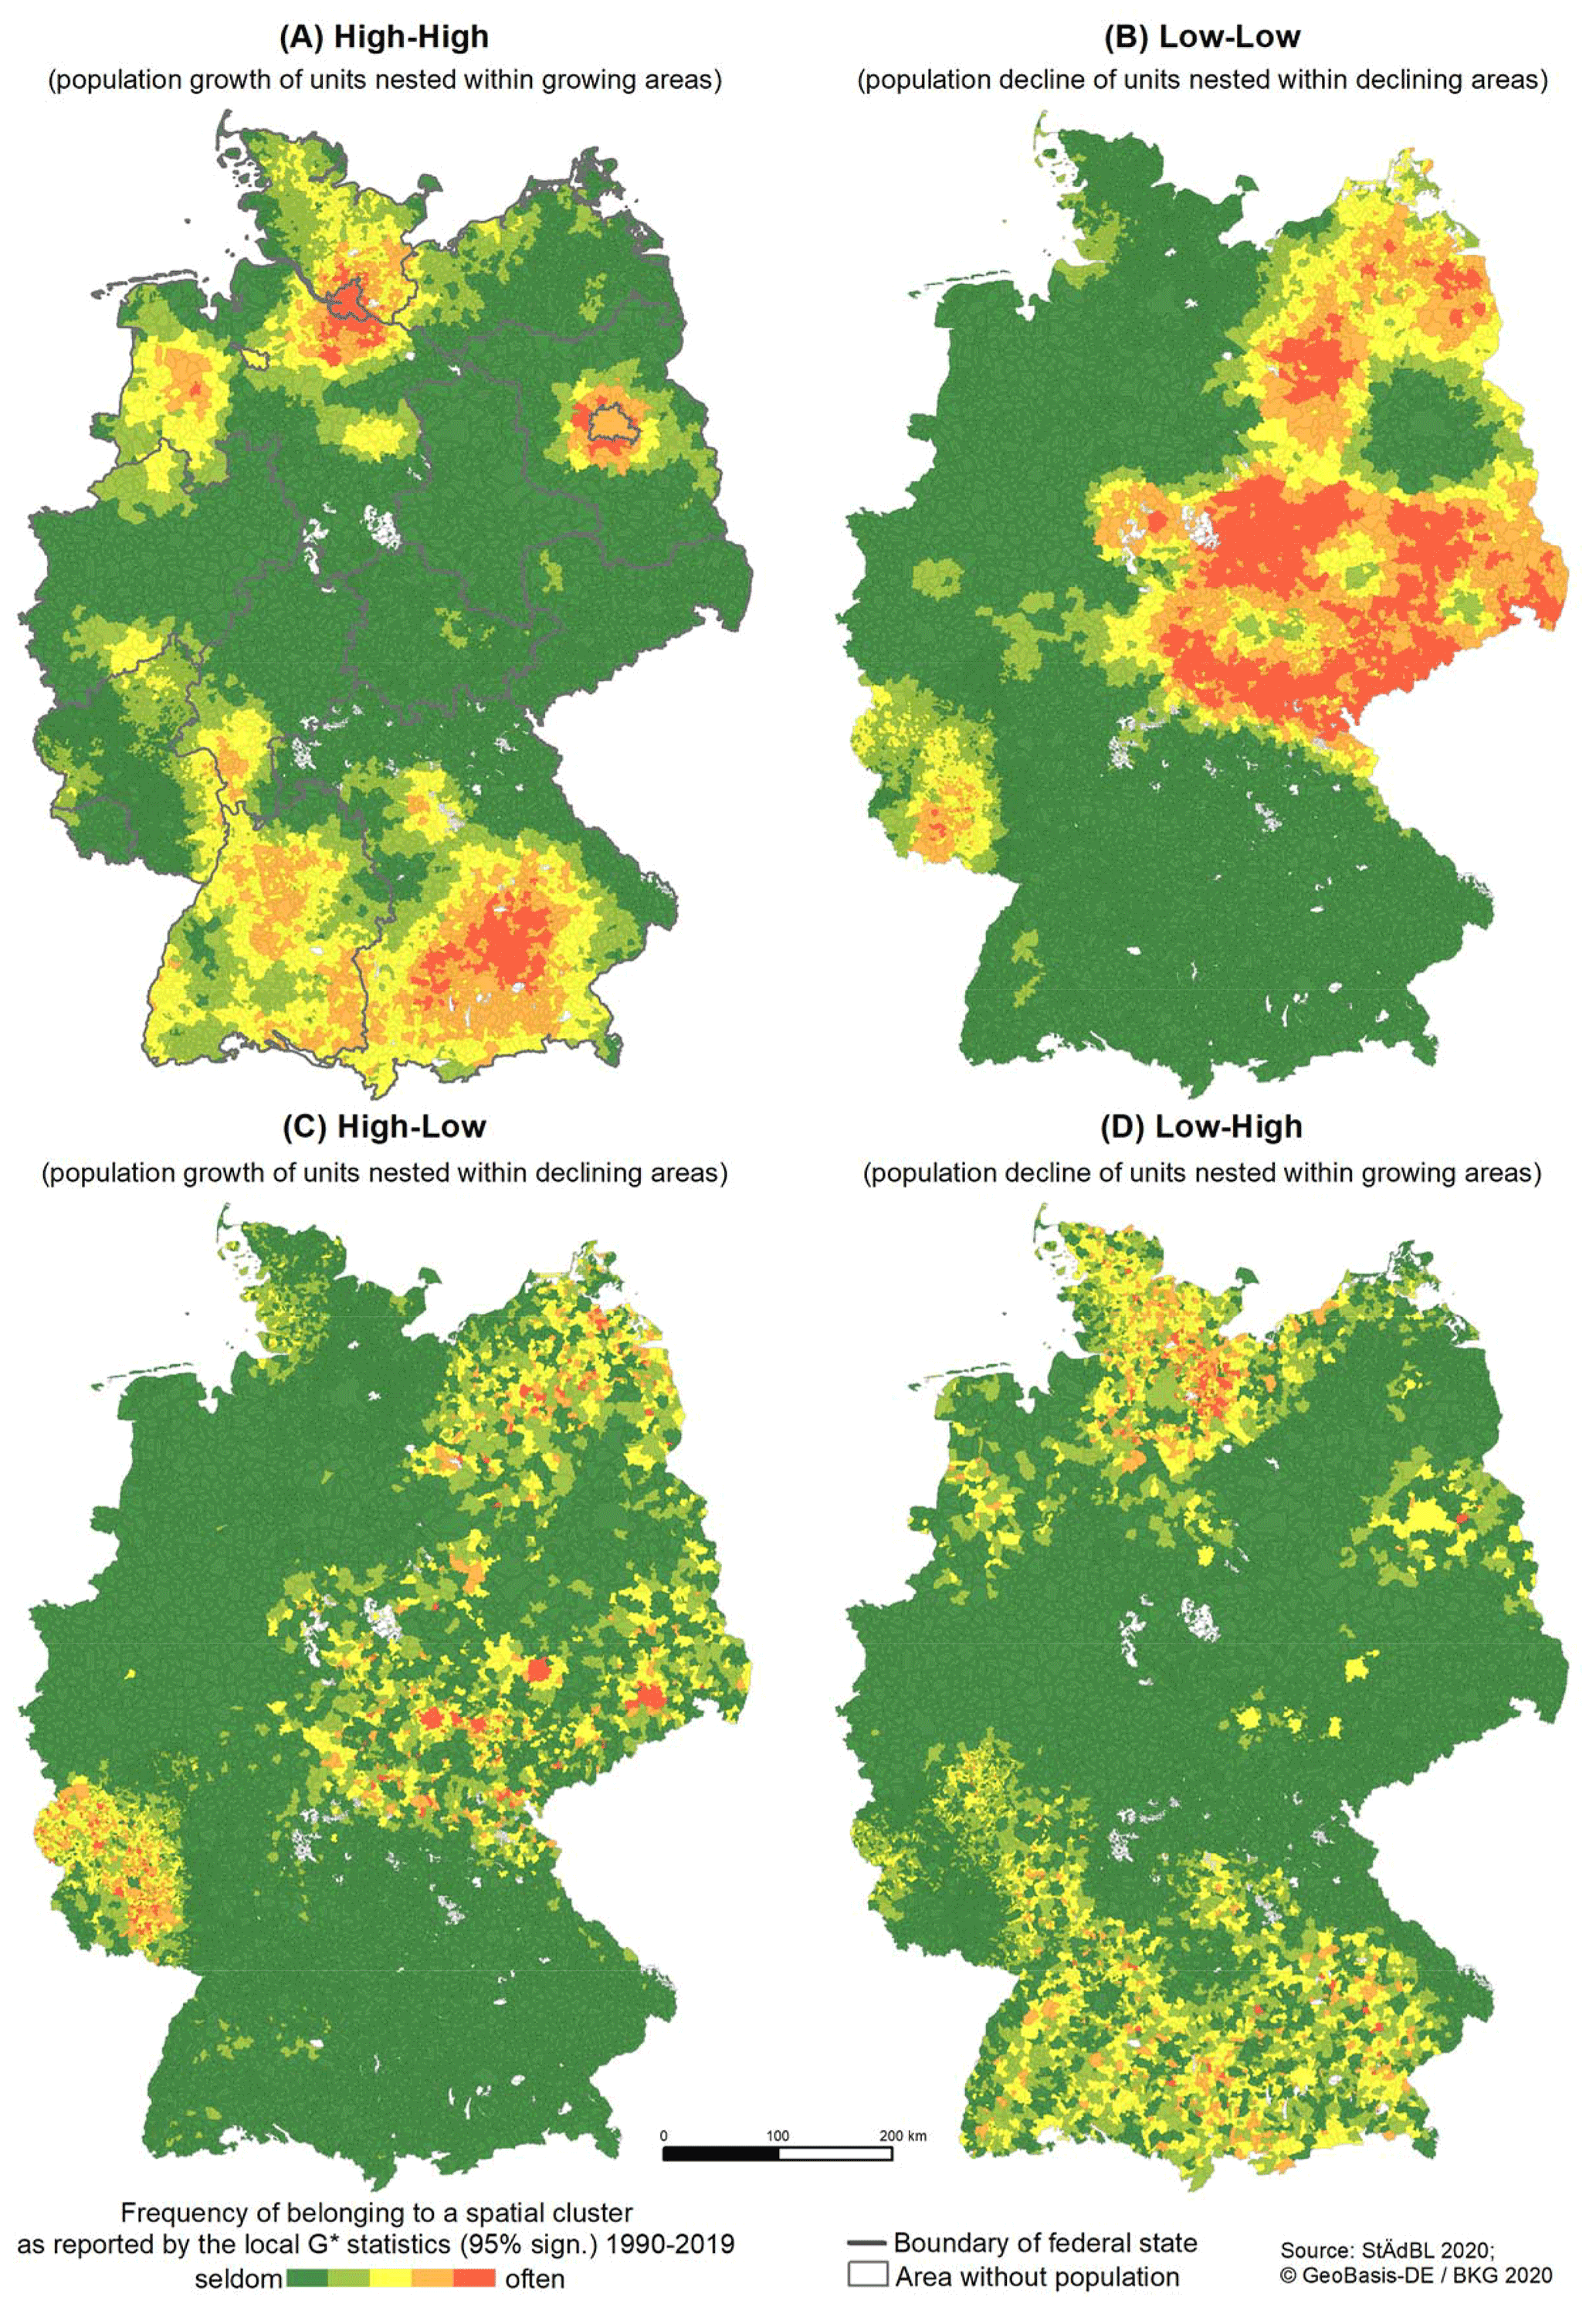
Figure 3Summary of the results of the hot- and cold-spot analysis of the local G* statistics 1990–2019 at the LAU2 level. Source: authors' calculations.
4.1 Patterns of population change
The results of the analysis are depicted in Fig. 3 (municipalities) and Fig. 4 (Gemeindeverbände), which show concentrations of growing and shrinking municipalities in certain regions, i.e., clear patterns of hot and cold spots of population change. However, not all municipalities follow the dominant pattern. Certain municipalities deviate from the dominant trend, leading to isolated islands of shrinkage in growing regions and islands of growth in shrinking regions. It is worth mentioning that population development in large parts of Germany did not differ significantly from the nationwide trend between 1990 and 2019.
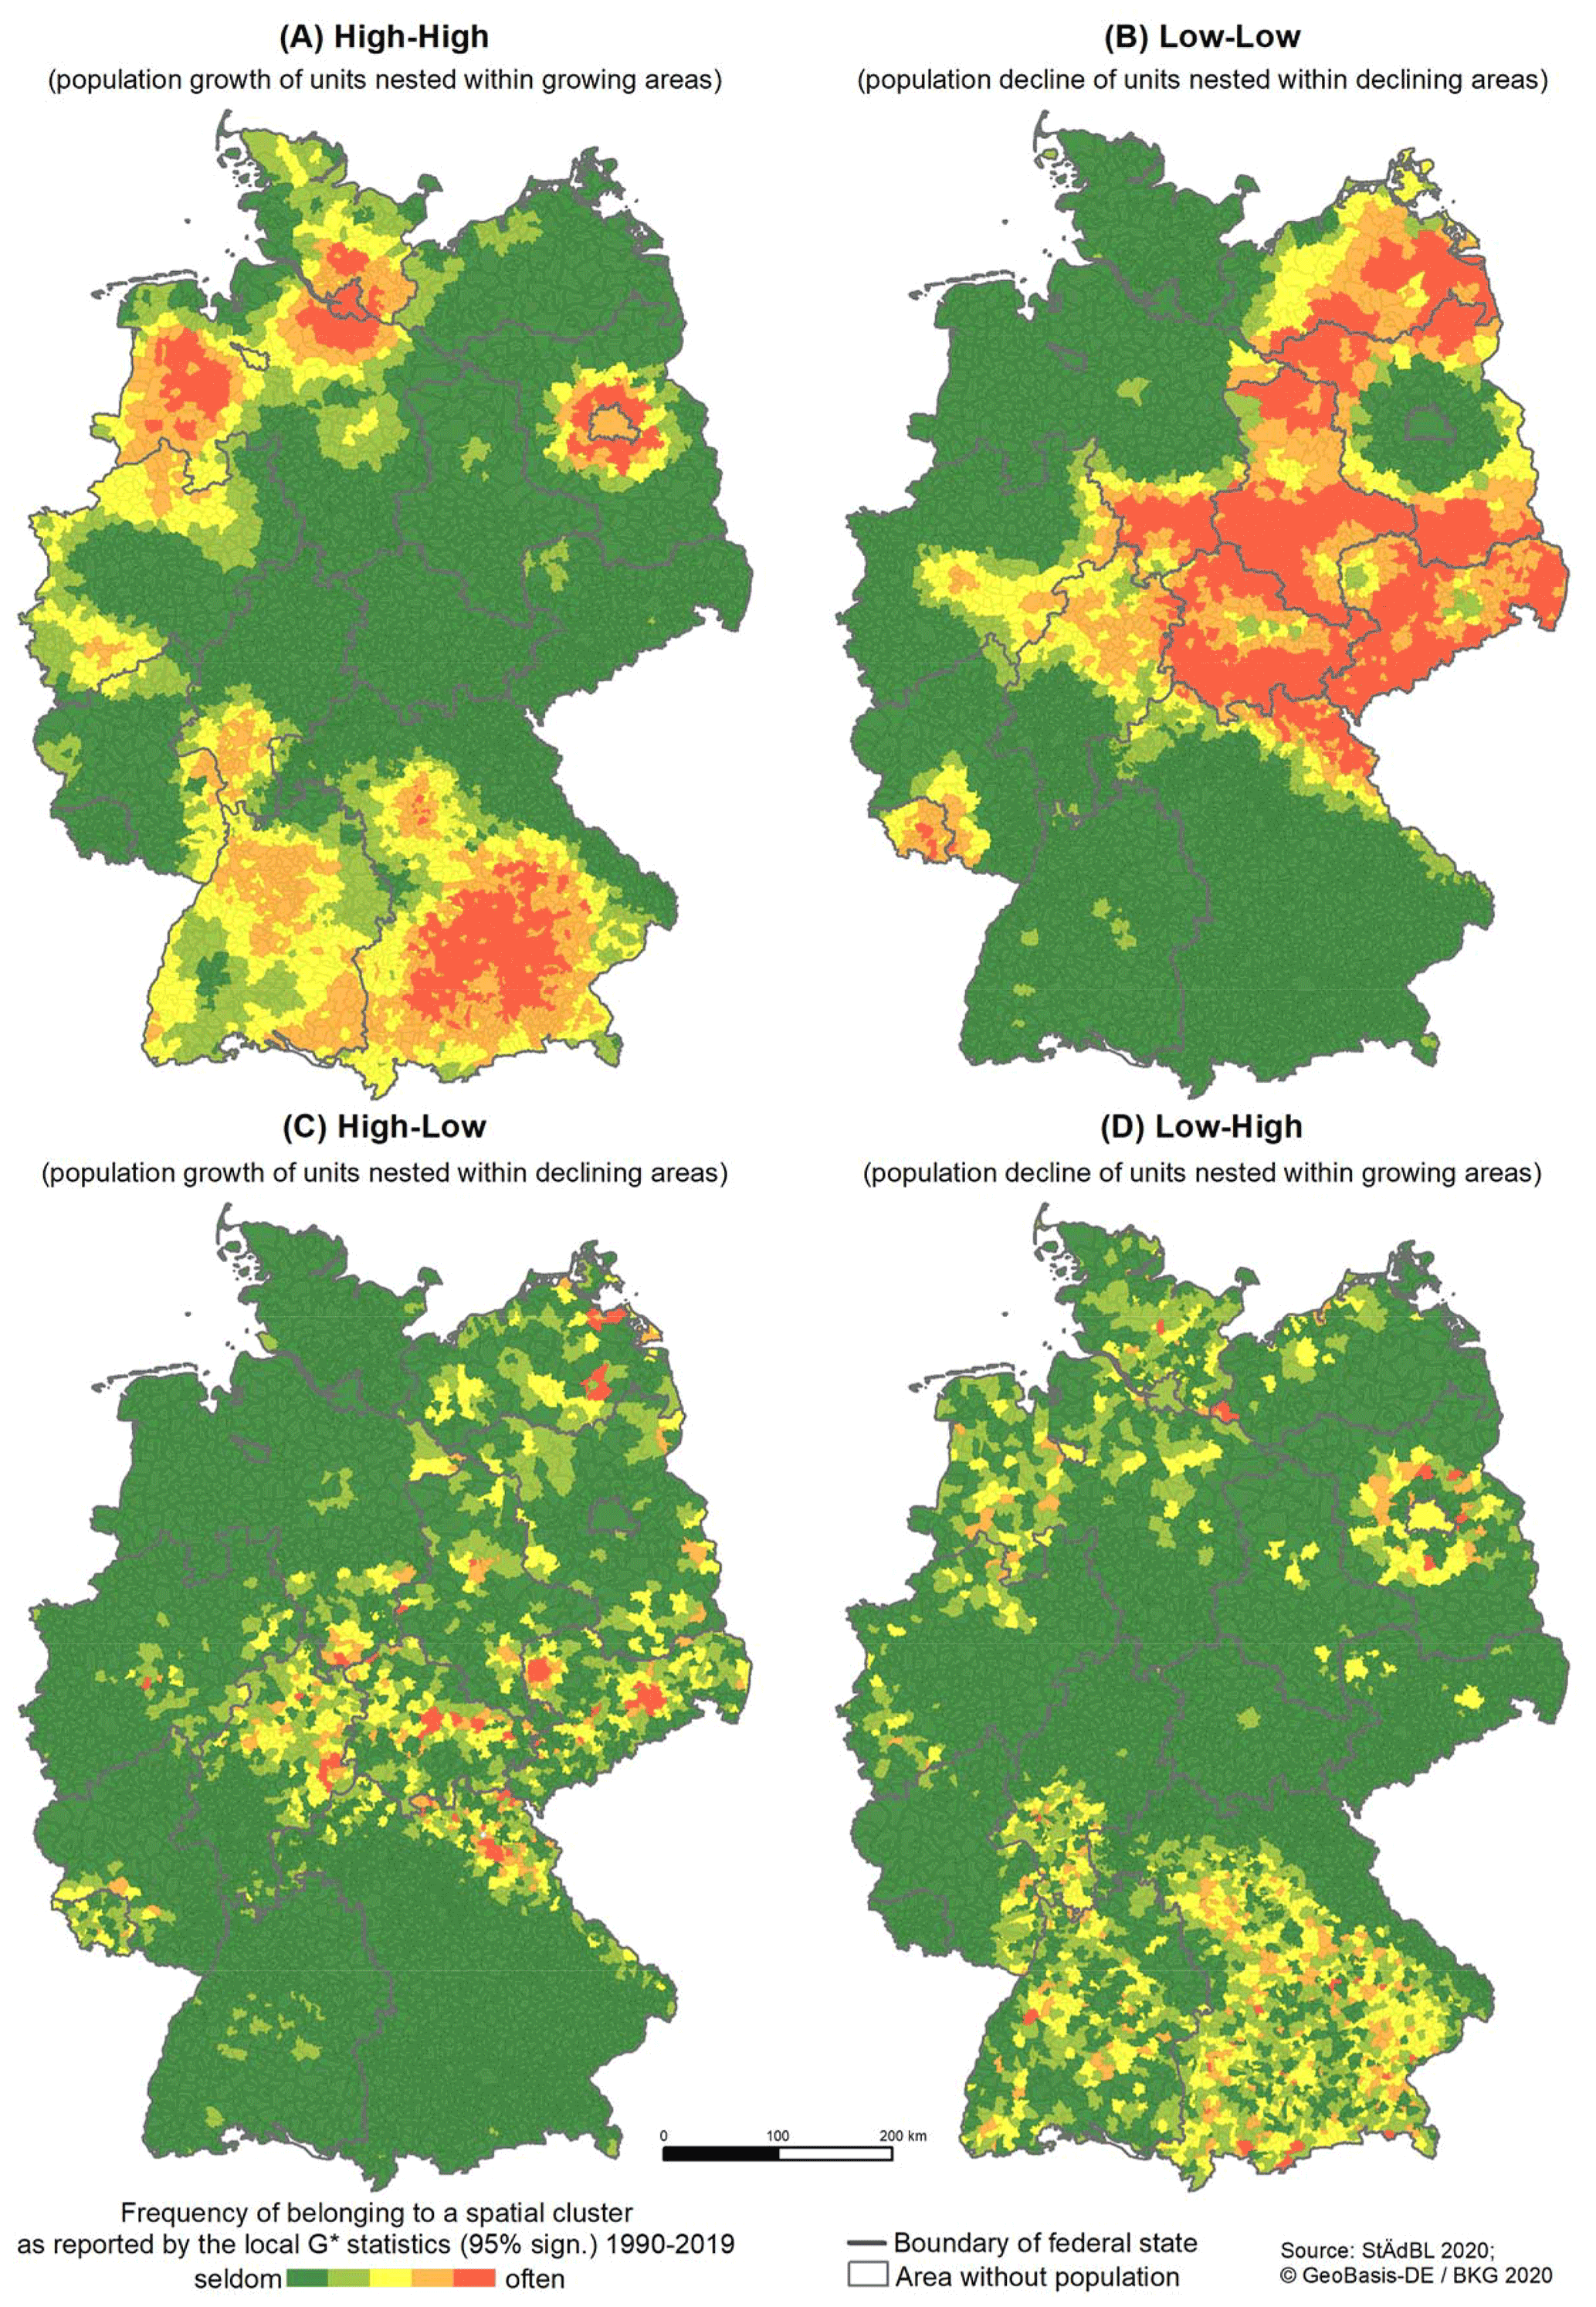
Figure 4Summary of the results of the hot- and cold-spot analysis of the local G* statistics 1990–2019 at the LAU1 level. Source: authors' calculations.
Table 2Characteristics of the municipalities located in hot and cold spots of population development. Source: authors' calculations.
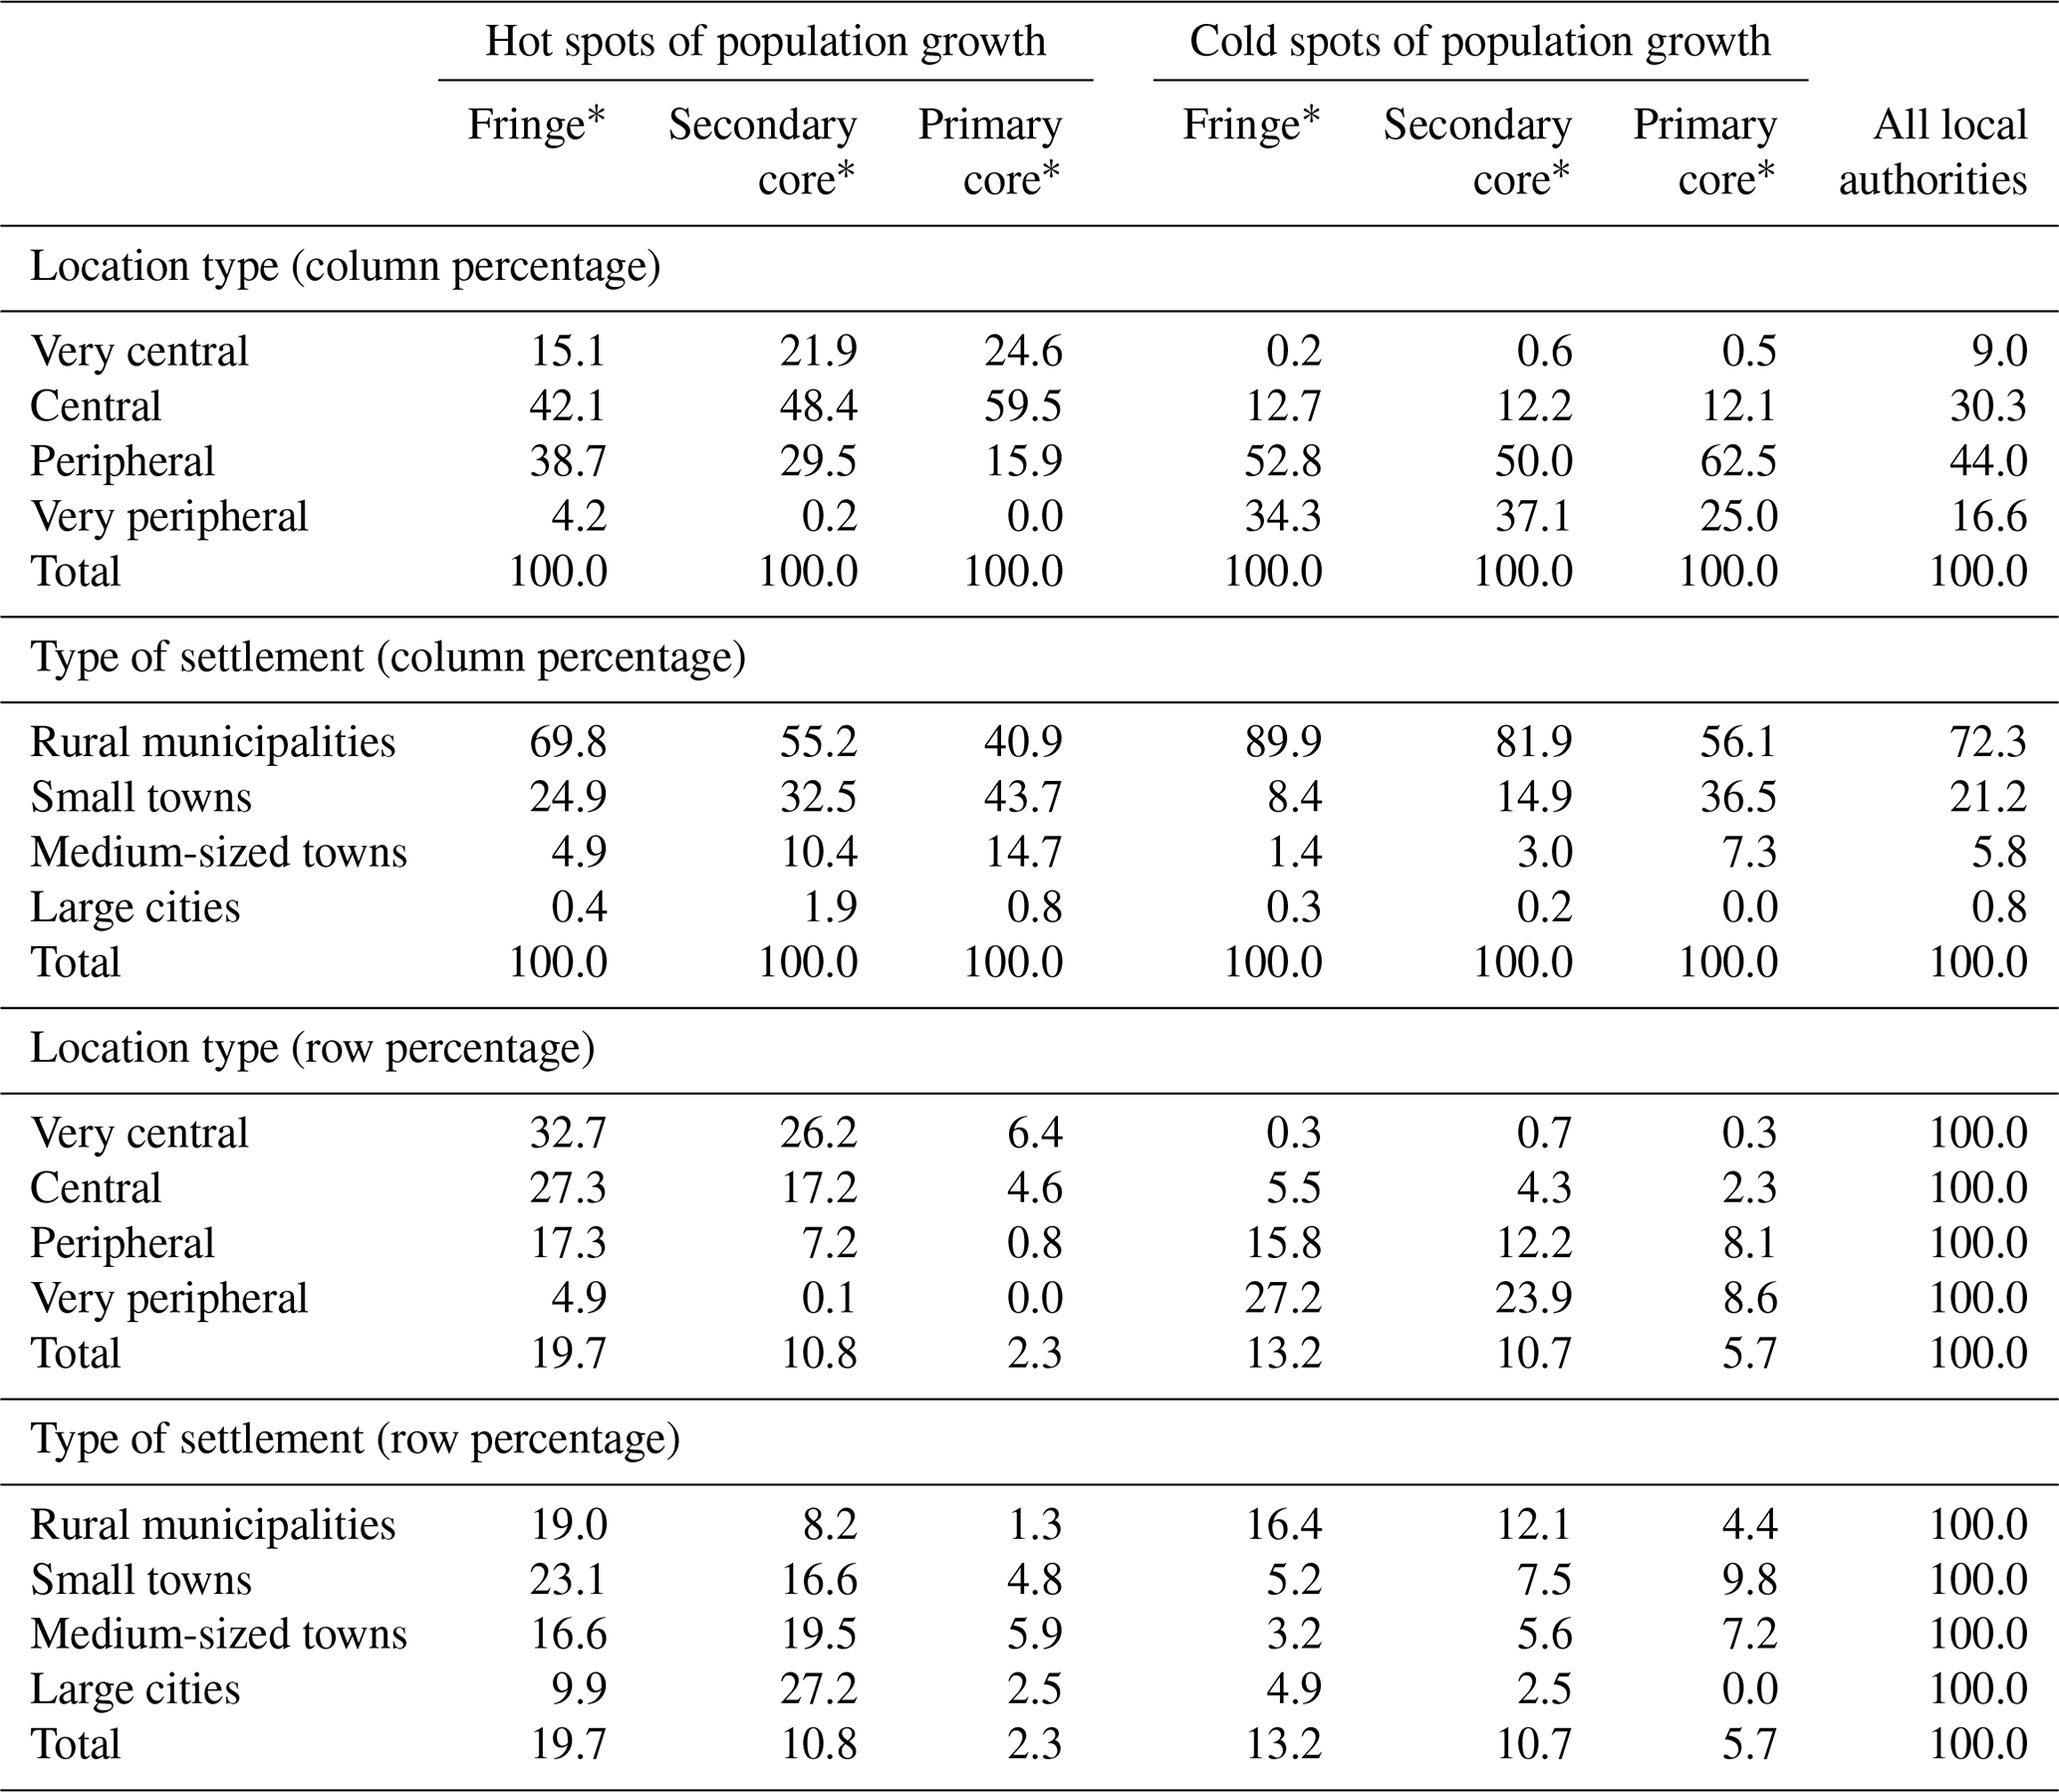
* Municipality was part of a hot or cold spot in 25 %–50 % (fringe), 50 %–75 % (secondary core) or more than 75 % (primary core) of analyzed years.
A comparison of Figs. 3 and 4 shows that the overall spatial patterns are similar to each other but that significant differences are discernible in the details. The spatial patterns in Fig. 4 stand out more clearly due to the larger area of the units of analysis. The LAU1 level is more advantageous for identifying hot and cold spots, while the LAU2 level is better for revealing local developments “against the regional trend”. In Baden-Württemberg, for example, the Black Forest and the Swabian Alps are clearly visible in Fig. 3d in contrast to Fig. 4d. Both mountain ranges are growth regions with a high density of shrinking municipalities. The local coexistence of growth and shrinkage in Schleswig-Holstein is also blurred at the LAU1 level. From a rural development perspective, it is important to know whether communities become islands of decline for topographical reasons or due to poor accessibility or whether the islands of decline are small villages or small- and medium-sized towns. We conclude that the LAU1 level is best suited to analyze large-scale patterns of population development, while the municipality level is better for illustrating the diversity of demographic trends in rural areas. The following sections refer to the analysis at the municipality level as this can reflect the diversity of small-scale population development better.
Based on a first interpretation of the spatial pattern depicted in Fig. 3, we can assume that systematic differences in population development are related to both the location and the type of settlement, at least to a certain extent. In Table 2, we distinguish between the primary core areas of hot and cold spots, defined as municipalities belonging to the high–high or low–low clusters in at least 75 % of the periods of time analyzed, secondary core areas (50 %–75 %) and fringe areas (25 %–50 %). The table shows that (very) central municipalities are strongly overrepresented in the hot spots of population development, especially in the primary core, while the opposite is true for the cold spots. The fringe of the hot spots extends into (very) peripheral regions, suggesting that population growth can “spill over” to more peripheral and rural regions under favorable conditions, such as in the 1990s when generous subsidies for the construction of single-family homes were available and this housing type and the way of life connected to it matched the preferences and ideals of large parts of the population. Another illustration is when, as we see it, for example in Upper Bavaria, the growth pressure of a metropolis such as Munich is so high that it spills over into rural areas beyond the suburbs (an area that is already large in the case of Munich). Interestingly, when looking at the cold spots, peripheral municipalities are more likely to be declining units nested in declining regions compared to very peripheral municipalities (see Table 2). Under the adverse conditions of intensified shrinkage, the decline spills over into the very peripheral areas and not to more centrally located municipalities (the percentage of central and very central municipalities is roughly 13 % in the fringe areas and the primary and secondary cores of the cold spots).
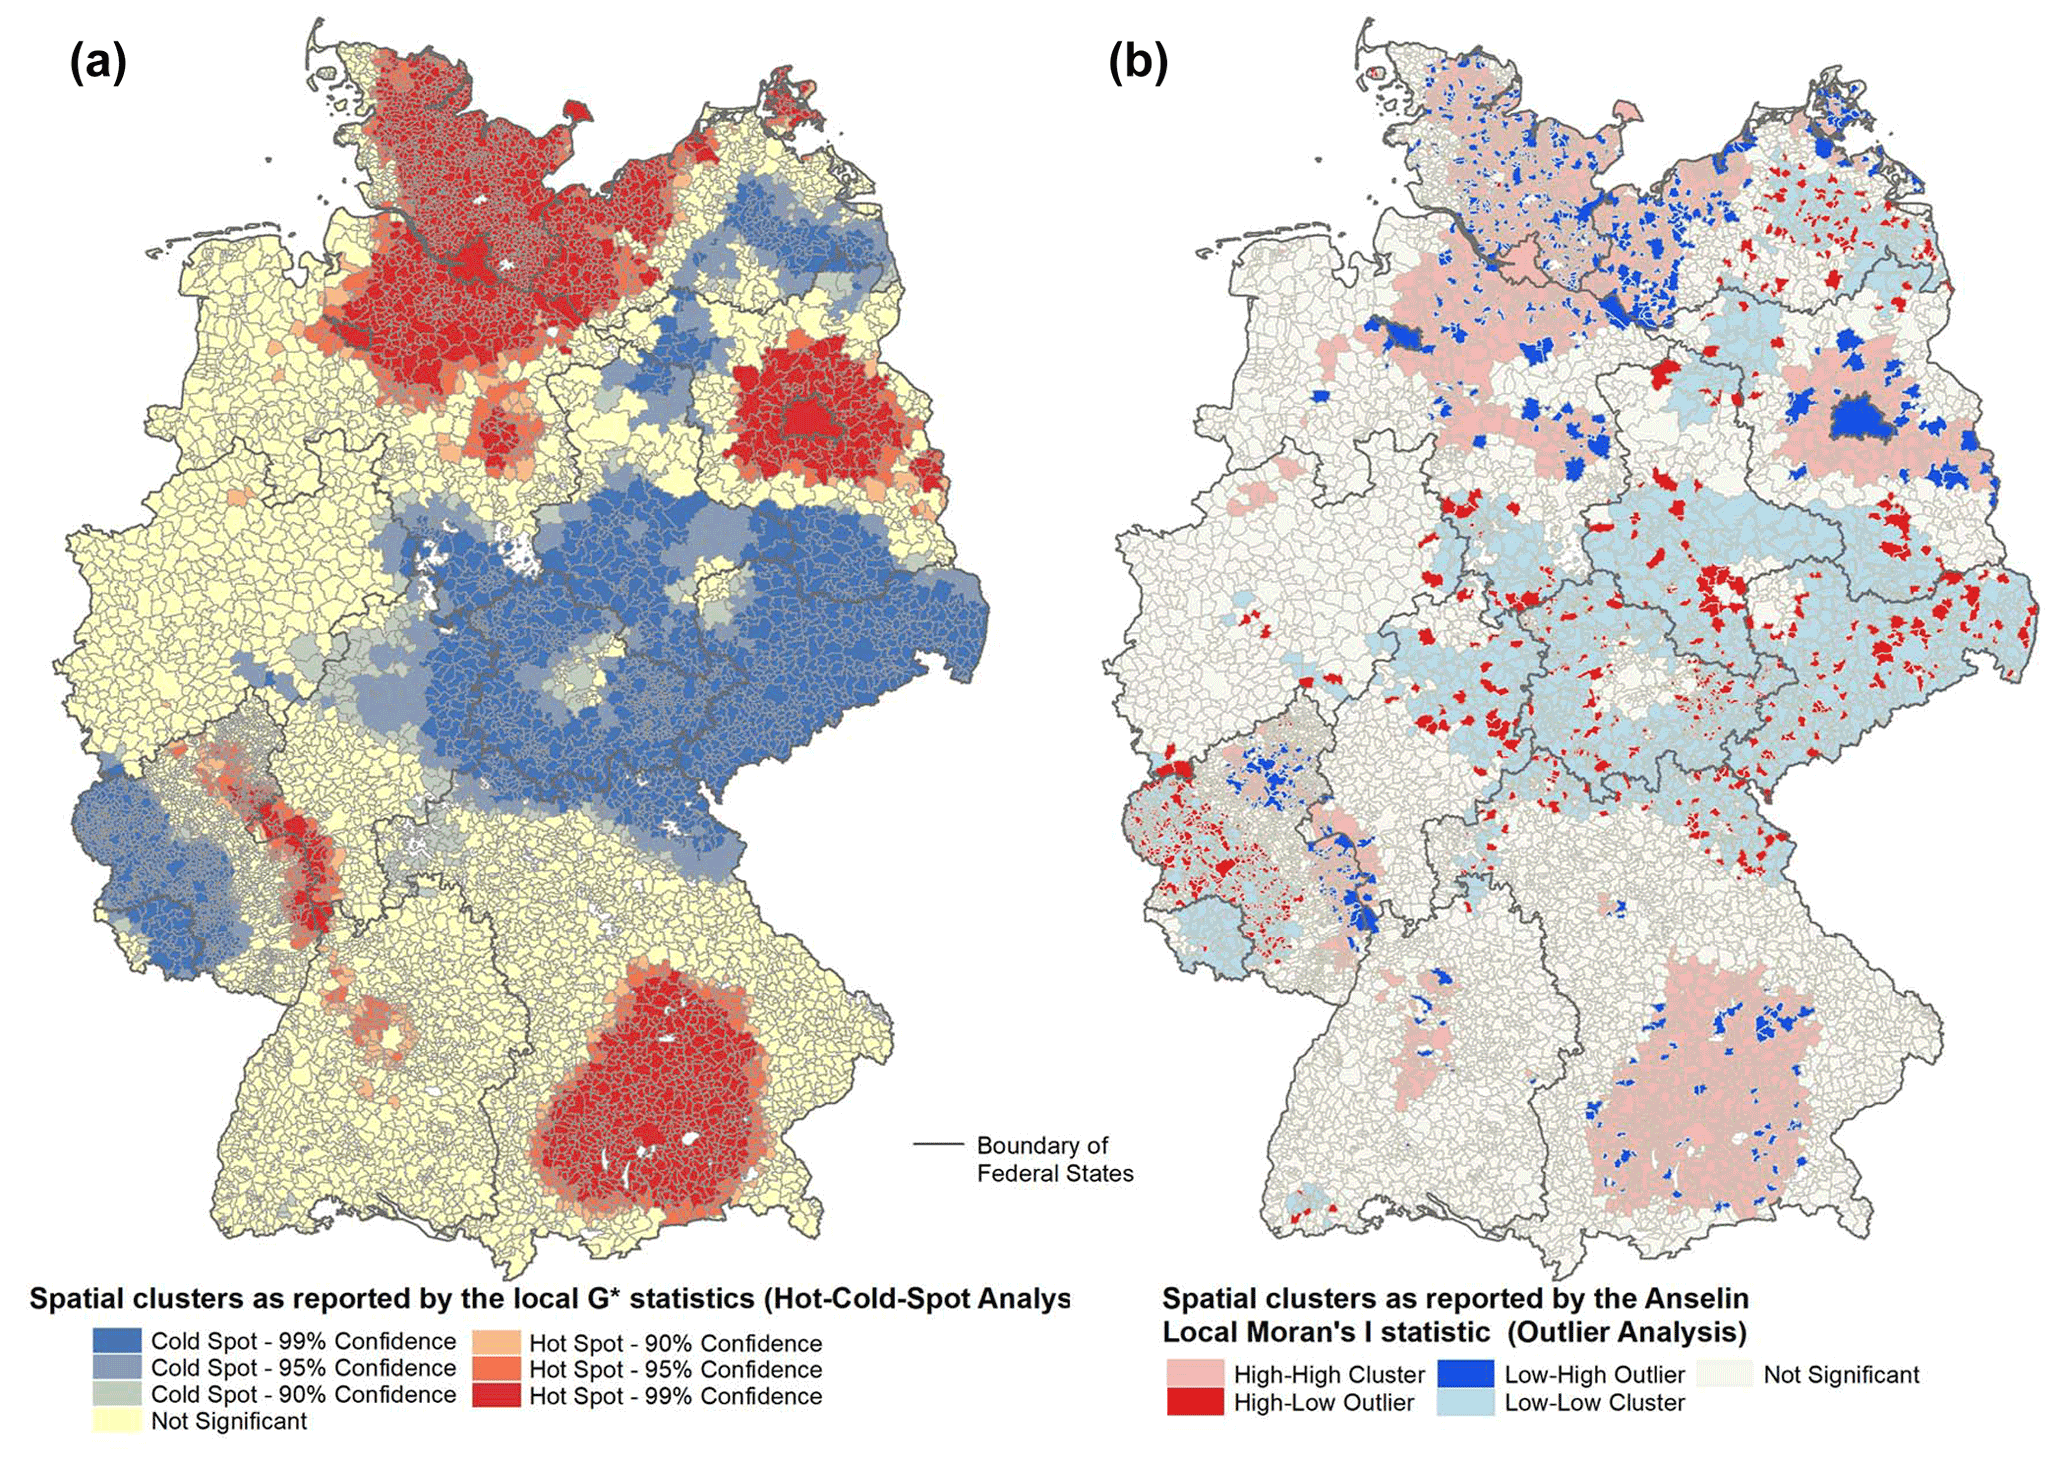
Figure 5Results of the hot- and cold-spot (a) and outlier (b) analysis for 1998–1999 at the LAU2 level. Source: authors' calculations.
4.2 Hot spots of population development
The hot spots of population development are, with one exception, economically prosperous regions around Germany's largest metropolitan areas. In the north of the country, Hamburg is the center of a hot spot of population growth that has been rather volatile over time. Besides Hamburg itself, the core of this hot spot includes the neighboring districts and extends into the westernmost parts of Mecklenburg-Western Pomerania. From the mid-1990s to the mid-2000s, the hot spot included large parts of Schleswig-Holstein and extended over an area from Bremen in the west along the Baltic coast to Rostock and even further east to Stralsund in some years (see Fig. 5). This large hot spot was the result of a combination of drivers. In addition to the economic strength of the city of Hamburg and its immediate hinterland, the suburbanization of cities such as Bremen, Kiel and Rostock played a vital role.
Berlin and the adjacent city of Potsdam are also the center of a stable hot spot of population development. Similarly to the whole of eastern Germany, Berlin and the surrounding municipalities lost inhabitants due to the pronounced migration stream from eastern to western Germany in the early 1990s (see Fig. 6). The picture changed from the mid-1990s when suburbanization gained momentum, especially in the period of 1995–1999 when the growth pole stretched in an east–west direction from the Polish border to the border of Saxony-Anhalt. The suburbanization of Berlin and the growth impulses connected to the decision to relocate government functions from Bonn to Berlin were not the only factors contributing to the spillover of growth to the peripheral rural regions of Brandenburg. The suburbanization of other urban centers and medium-sized industrial cities (e.g., Eisenhüttenstadt) in the state of Brandenburg was also instrumental. The hot spot of population development shrank considerably during the 2000s and most of the 2010s to the now reurbanizing cities of Berlin and Potsdam and the municipalities directly adjacent. Suburbanization has been gaining momentum again since 2016. The growth pole has extended into rural areas to the northeast of Berlin because of increasing housing prices and rents in the city (see Fig. 7).
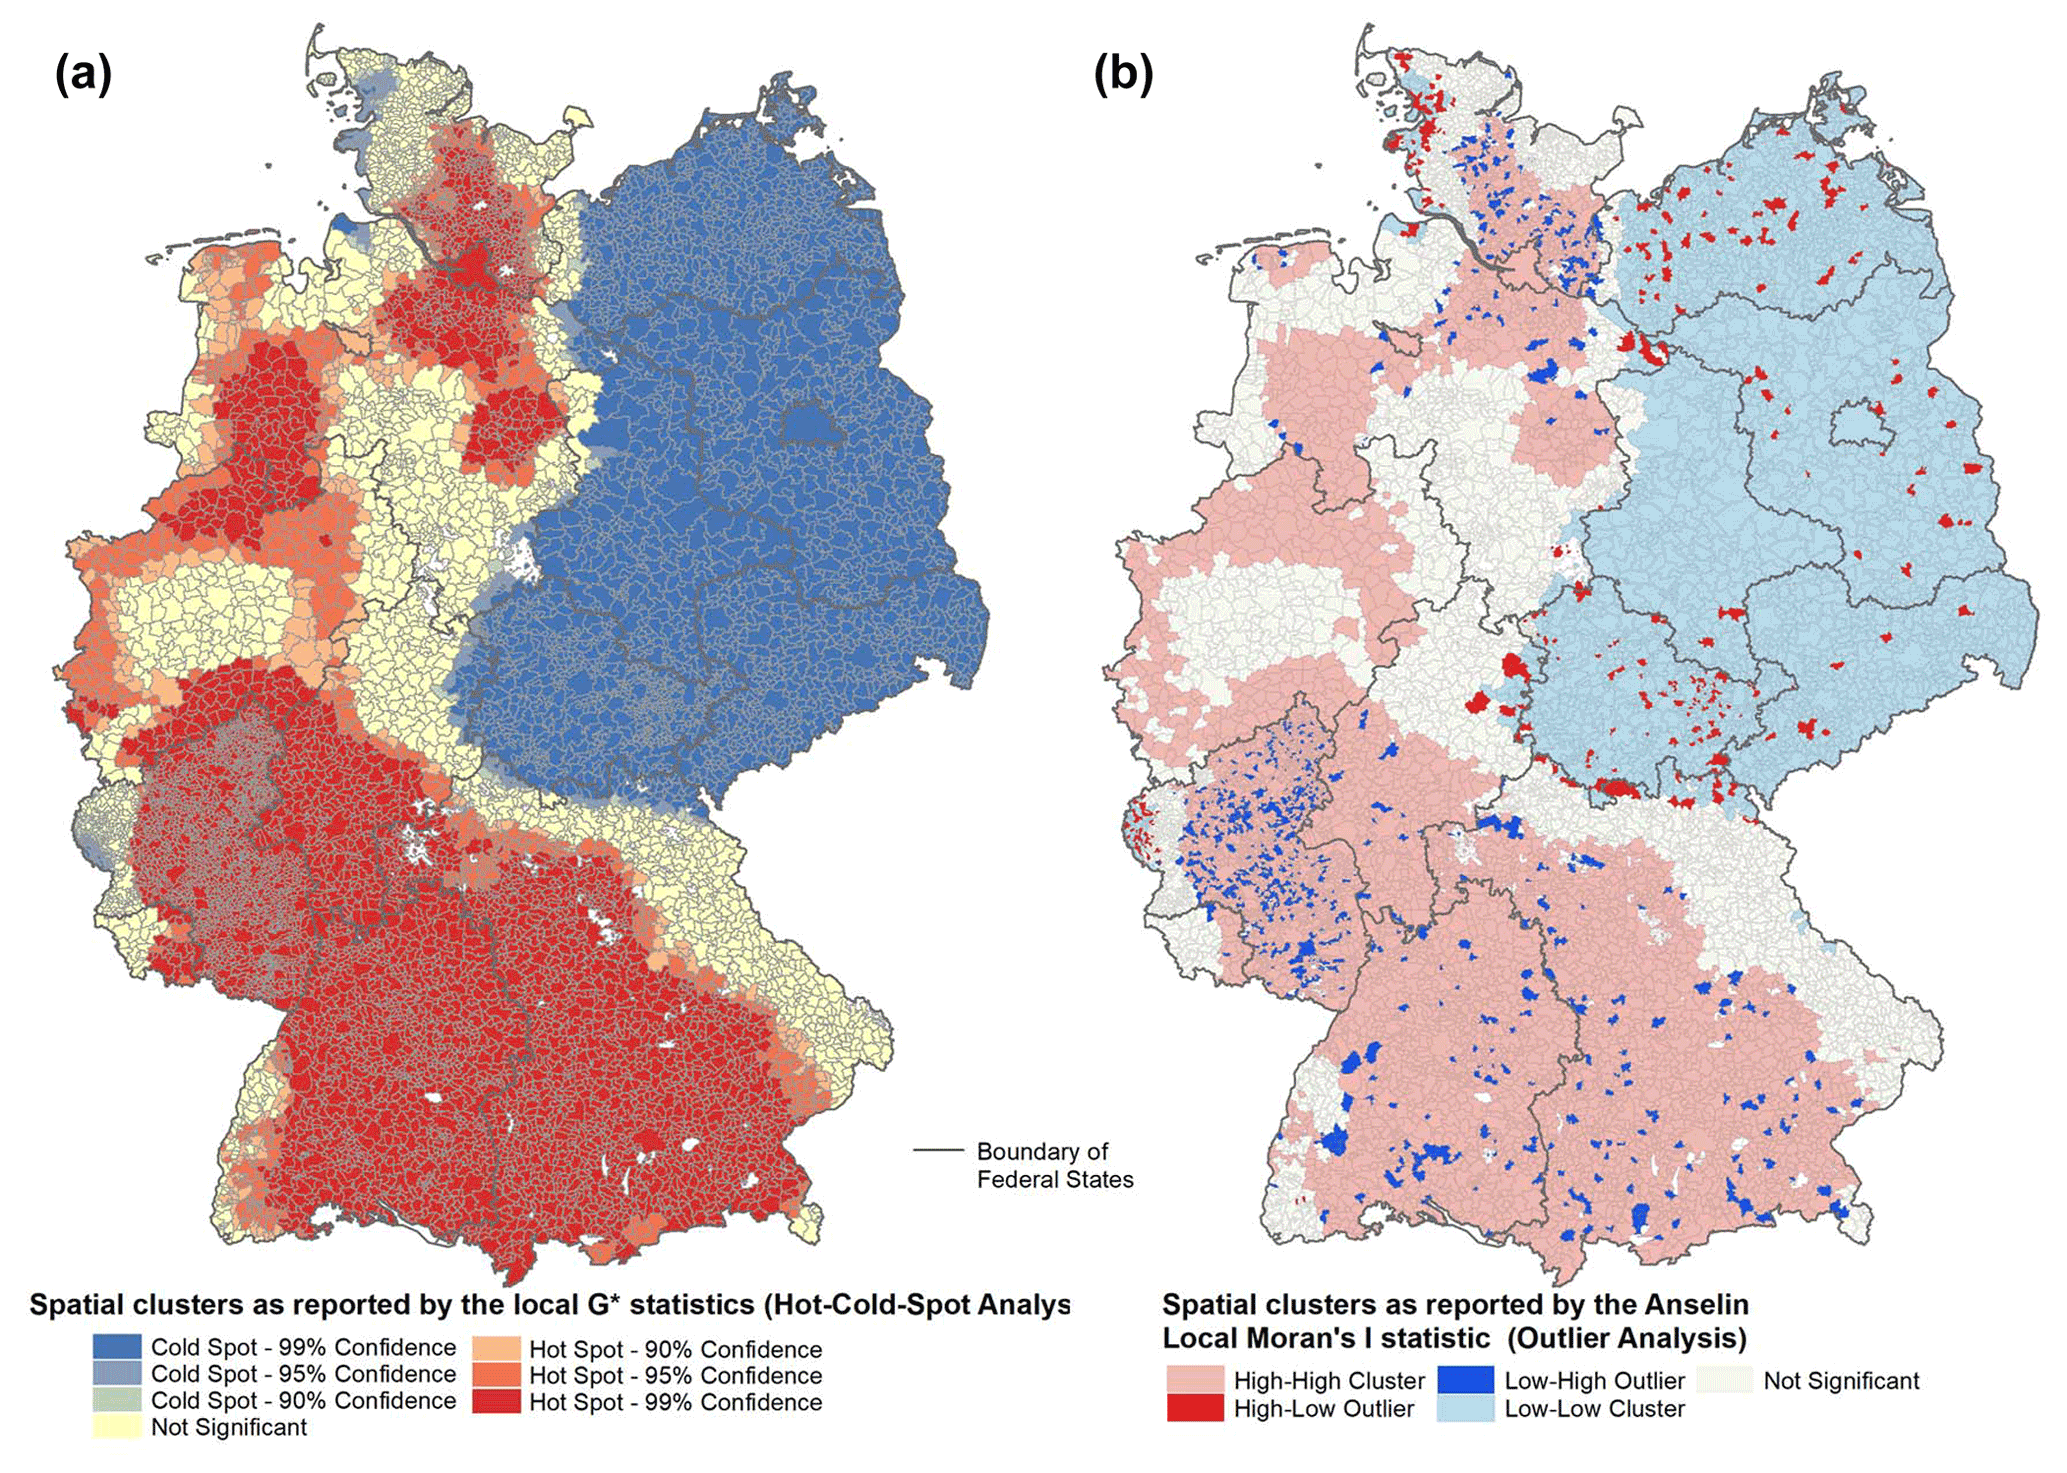
Figure 6Results of the hot- and cold-spot (a) and outlier (b) analysis for 1990–1991 at the LAU2 level. Source: authors' calculations.
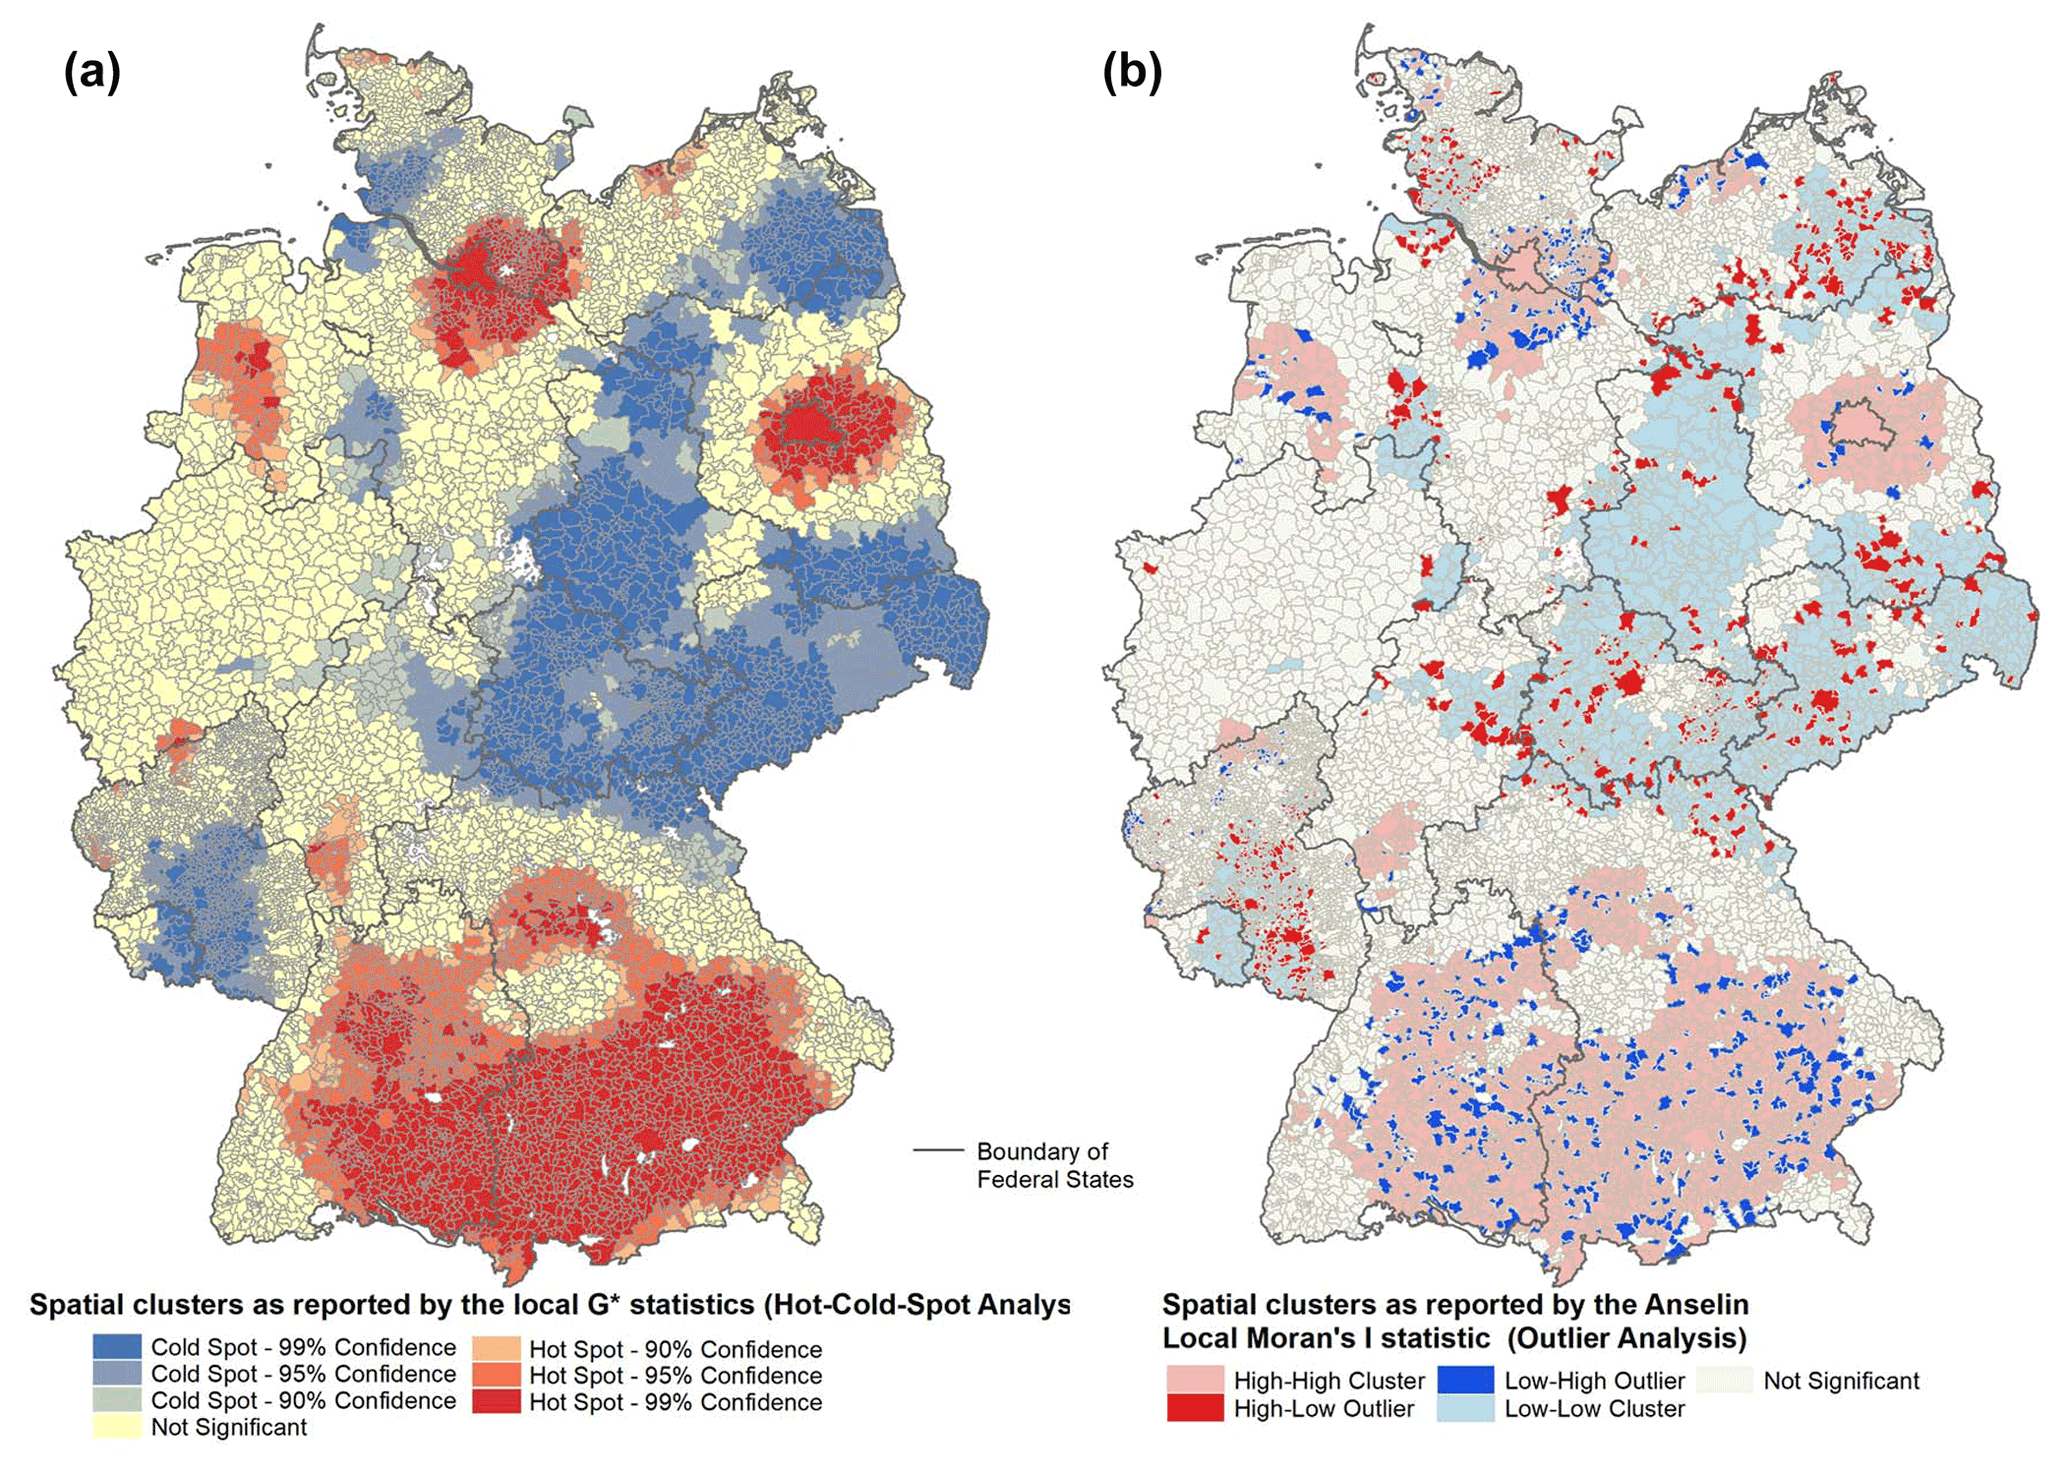
Figure 7Results of the hot- and cold-spot (a) and outlier (b) analysis for 2017–2018 at the LAU2 level. Source: authors' calculations.
Munich, Germany's third-largest city, is also the center of a hot spot of population development covering large parts of southern Bavaria. This area is one of the economic powerhouses of Germany, with consistently low unemployment rates and above-average economic growth. Munich and its hinterland are also notorious for high rents and real estate prices as well as an above-average cost of living. This is possibly the reason why – in contrast to the hot spots mentioned previously – the expansion of the continuous area of population growth has increased rather than decreased during the 2000s and 2010s. Many local authorities have belonged to the high–high cluster in at least 25 out of the 28 periods under investigation.
A less stable hot spot of population development can be found along a line connecting Frankfurt (Main) with Lake Constance. These parts of Baden-Württemberg and Hesse are among the economically most developed regions of Germany. Looking at the development over time, this hot spot virtually disappeared in the middle and late 1990s (see Fig. 5), while it merged with the growth pole around Munich during much of the 2000s and the 2010s, creating one big hot spot covering most of the area south of the river Main (see Fig. 7).
There is one outlier among the hot spots of population development: the Emsland region and the Oldenburg Münsterland in Lower Saxony with a core in the district of Cloppenburg. This growth pole is located in a sparsely populated rural region without any major cities. The region is economically quite successful – not least as a result of major infrastructure investments after World War II and a favorable economic structure (Danielzyk, 2007; Glander and Hoßmann, 2009). Demographically, the region is characterized by a surplus of births and net migration gains (Leibert, 2019). The positive natural balance results from birth rates well above the German average – Glander and Hoßmann (2009) trace back the high fertility to an elevated level of religiousness and attachment to “traditional values” in this devoutly Catholic area. The region has also profited significantly from the international migration of both European Union (EU) citizens, especially from the new member states in central and eastern Europe, and late repatriates, i.e., German nationals with a Russian or Kazakh migration background (see Fig. 4 in Heider et al., 2020).
4.3 Cold spots of population development
The cold spots of population development are concentrated in rural eastern Germany and the regions on the western side of the historical Iron Curtain, for example, parts of Upper Franconia or northeastern Hesse. It is striking that infrastructural investments and the new advantage of being located in the center of the country instead of along a hermetically sealed border have not resulted in a significant improvement in the demographic situation of many of the regions directly west of the former Iron Curtain in the last 30 years. The only exceptions are the catchment areas of Hamburg, Brunswick and Wolfsburg, which extend into the westernmost parts of Mecklenburg-Western Pomerania and Saxony-Anhalt. In 1990, when literally the whole of the FRG profited from the severe population losses of the GDR on the eve of reunification, these regions were among the few remaining cold spots of population development (see Fig. 6). This pattern underscores the importance of large cities as economic and demographic cores in regional development. The remaining regions along the former border between the GDR and FRG suffer from a lack of major urban centers on both the eastern and the western sides.
A second cold spot is located in the eastern part of Saarland around the former centers of mining and heavy industry and rural areas in the adjacent districts of Birkenfeld and Kusel in Rhineland-Palatinate. Looking at Rhineland-Palatinate and Saarland, it is worth mentioning that the cold spot along the borders with Belgium, France and Luxembourg, which featured a stable pattern throughout the 1990s, has mostly disappeared since the 2000s. Apart from Luxembourgian citizens moving to the German side of the border (Reichert-Schick, 2017; Fig. 4 in Heider et al., 2020), this trend might also – at least in part – be a result of the European single market and increased cross-border cooperation (also see Heider, 2019).
Looking at the characteristics of the municipalities located in the cold spots of population development, it becomes clear that rural municipalities are overrepresented in the fringe areas and the secondary core, while small- and medium-sized towns are overrepresented in the primary core, indicating that it is especially difficult for small- and medium-sized towns in regions with a declining population to overcome shrinkage (Table 2). From a regional development point of view, this is problematic as these smaller urban centers provide the services of general interest for their rural hinterlands. Further population decline implies the risk of a loss of critical masses of clients, passengers, patients and pupils to sustain these services and is, therefore, a threat to the whole region. An explanation as to why small- and medium-sized towns seem to be the primary core of the cold spots of population development is the fact that these municipalities have – as a result of a history of selective migration, negative economic trends and infrastructural disinvestments – a very unfavorable population structure with a high percentage of senior citizens (Weber and Fischer, 2012). As a result, the cold spots are typically characterized by a combination of out-migration and a negative natural balance caused by a high surplus of deaths, especially in times of low international migration (Wolff et al., 2022).
4.4 Islands of growth in shrinking regions
The overwhelming majority of islands of growth in shrinking regions are rural municipalities, typically located in peripheral and very peripheral areas of Mecklenburg-Western Pomerania, Rhineland-Palatinate and Thuringia. A second group consists of large- and medium-sized cities and suburban municipalities in eastern Germany. The former recorded a comparatively unfavorable population development during the 1990s, at the height of the post-reunification suburbanization boom, and experienced a sometimes significant trend reversal in the 2000s and 2010s when reurbanization became the dominant trend in Germany. The suburban municipalities in question are closely integrated with their adjacent urban centers. As a result, their population development has resembled the demographic trends observed in their respective urban centers during the reurbanization period in the 2000s and 2010s. These municipalities have been beneficiaries of the suburbanization wave in the 1990s, similarly to the other villages and towns in the surrounding areas of eastern Germany's larger cities. In contrast to their neighbors, they were able to decouple themselves from the negative suburban population development in the region during the 2000s and 2010s, possibly because of their close links to the respective central city, good infrastructure and accessibility, and/or other location-specific advantages. A third group consists of small towns, mostly in Rhineland-Palatinate, which are local administrative centers and provide services of general interest for the surrounding villages. Finally, a fourth group consists of rural municipalities in Brandenburg and Mecklenburg-Western Pomerania that used to be small villages in GDR times. Local decision-makers used the windows of opportunity during the short phase with legal vacuums in spatial planning in the early 1990s to turn specific locational advantages, such as being the suburb of a medium-sized town or a small center of employment, into a relatively permanent favorable population development.
4.5 Islands of shrinkage in growing regions
We can distinguish three types of islands of shrinkage in the period under consideration:
-
large and medium-sized cities, especially in Schleswig-Holstein, which belonged to this group during the 1990s;
-
remote villages and small towns; and
-
municipalities with favorable accessibility indicators but limited development opportunities in terms of land available for residential developments.
It is difficult to assign a municipality unequivocally to either type 2 or type 3 from a longitudinal perspective because of infrastructure investments, especially in motorways and federal highways. Regarding type 2, the main reason for being an island of shrinkage is poor accessibility, while for type 3, the main driver is a lack of building sites and/or very high real estate prices. The vast majority of municipalities belonging to the second and third groups have less than 2000 inhabitants. In contrast to the first group, the temporal pattern is less clear, possibly because of the timing of infrastructure investments and/or the small population of the municipalities in question.
A lack of development opportunities, notably a lack of space for new residential developments in the municipal territory, may be a reason why local authorities become islands of shrinkage. An extension of the settlement area to attract new residents is difficult because of the topography, nature protection or planning policies to discourage residential developments in small municipalities. Regional plans in some federal states stipulate that new residential developments in small municipalities are only possible to satisfy the needs of the local population (Domhardt, 2018). Under the conditions of limited space for new residential developments, the tendency of homeowners to stay in their homes as they age and become empty nesters leads to a high per capita consumption of residential space and an inefficient use of the existing housing stock. It is not uncommon for one elderly person to live alone in a two-family home. Under such conditions, the local real estate market is basically “blocked” for newcomers.
Rural gentrification (Reichert-Schick, 2017), defined as a high share of secondary residents, may also contribute to declining populations in growing regions. It might lead to wealthy urbanites buying houses and building plots in villages in scenic regions close to large cities. The increased demand leads to rising real estate prices and the possible crowding out of locals who cannot afford the increased price level. A declining or stagnating population is not necessarily an indicator of unattractiveness at the local level (even though this is certainly the case at the regional level). A lack of development opportunities, such as new residential developments, results in untapped potential for attracting new inhabitants and, consequently, a rerouting of population growth to neighboring municipalities.
Our analysis has shown that there are hot and cold spots of population development in Germany with rather stable core areas and a more volatile fringe. These hot and cold spots expand and contract over time in response to overarching societal, economic and demographic trends, notably changing migration patterns. The hot spots of population development are centered on Germany's largest cities and their immediate hinterland. The directions in which the hot spots have extended into more peripheral regions vary over time. We can assume that both the infrastructure development and real estate prices play a role in shaping the spatial development of the hot spots, but this assumption requires further and more in-depth research. The primary and secondary cores of the hot spots consist mostly of municipalities in (very) central regions; small- and medium-sized towns are overrepresented (see Table 2), suggesting a close connection between urbanization and population growth in Germany over the last 30 years. The example of the Ruhr area – a densely populated and highly urbanized region but with no hot spot of population development – shows that economic success and the density of economic, cultural and political leadership in a dominant city seem to be another decisive factor in the development of stable hot spots of population development. The cold spots, on the other hand, are located primarily in economically weak, less accessible and predominantly rural regions.
We also demonstrated that – at a closer look – there are municipalities which, for different reasons, defy the general trends and form islands of growth in declining regions and islands of decline in growing regions, which are not stable over time. This observation leads to the conclusion that, in most cases, the reasons for the special development are only temporary (e.g., economic restructuring) or that the positive or negative influence of structural factors (e.g., poor accessibility) only comes into effect under certain conditions. The small rural municipalities among the islands of growth in shrinking regions represent especially interesting cases to study the role of specific locational advantages or visionary actions made by key stakeholders who used of windows of opportunity.
A comparison of longer-term demographic and economic development shows that employment development can be an important partial explanation for hot and cold spots. Some “loser regions” of globalization or economic structural change (Südekum et al., 2016) are simultaneously cold spots of population growth (e.g., Western Palatinate or Upper Franconia). The “winner regions” (Südekum et al., 2016) also tend to be areas with strong population growth (e.g., southern Bavaria or the Oldenburg Münsterland). On the other hand, regions undergoing a long-lasting and painful structural change (e.g., the Ruhr area) do not necessarily have to go through a comparable demographic crisis. The large cities that have grown strongly tend to be middle-ranking in terms of employment growth. It is also questionable whether local economic shocks (e.g., the loss of a major employer) will permanently turn a community into an island of shrinkage. In an otherwise economically strong region, people are more likely to react by commuting, especially if they own a home. In other localities, young adults return to their home municipalities as soon as they have finished their education, while the problem in other municipalities is that these people leave but do not return. The comparison of demographic and economic development consequently indicates that the intraregional differentiation of demographic development is the expression of a complex interplay of different factors at various levels. The significance of the respective components changes from municipality to municipality and over time.
It is also important to think beyond the borders of the nation-state when analyzing small-scale population development in Germany and other EU states. In the German case, it is worth noting that the border regions with Belgium, France, Luxembourg, the Netherlands and Switzerland form parts of the dorsale européenne (European backbone), better known as the “Blue Banana” (Brunet, 2002). This densely populated corridor with a high level of economic development has been discernible at least since the late 19th century. The Blue Banana connects southern England, the Low Countries, western and southern Germany, Switzerland, and northern Italy (Klüsener and Zaghini, 2014). Three important cross-border metropolitan regions are located in this area: the Meuse–Rhine Euroregion (Aachen–Liège–Maastricht), the Greater Region (Luxembourg–Metz–Trier–Saarbrücken) and the Upper Rhine (Basel–Freiburg–Strasbourg) with extensive cross-border links and cooperation (ESPON and University of Luxembourg, 2010). The cross-border dynamics along Germany's eastern borders are less advanced (Sohn and Stambolic, 2015). The economic development of border regions and fostering cross-border cooperation have been targets of EU regional policy for decades (Heider, 2019), so it is likely that national borders will continue to decline in importance.
The more borders lose their barrier effect and cross-border living spaces develop, the more important it becomes to examine population development not only in the nation-state “container”. The focal points of population development could lie beyond the border and, thus, be overlooked in an analysis that ends at the national border. This is especially relevant as the cross-border real estate price gap seems to have a significant influence on population development in the immediate border regions (Hoekveld, 2015; Krajewski, 2018; Reichert-Schick, 2017). However, there are still empirical and methodological problems, especially connected to data availability and comparability, which make the cross-border analyses of demographic and economic development challenging (Sohn and Stambolic, 2015). Even if we cannot resolve these problems here, we wish to underline that in a coalescent Europe, discussions such as the one on how to tackle such data availability and comparability issues on a supra-state level methodically and practically should receive more attention.
All in all, we are convinced that our methodological approach is well-suited to shed new and more detailed light on the spatial (and, to a certain extent, also temporal) patterns, trends and outliers of population development in Germany and to deal with the challenges related to the various “systems” of municipalities in the different federal states. We argue that a hot- and cold-spot analysis represents a promising first step in comparative analyses for detecting patterns in an unclear mosaic of population changes and is, therefore, also suitable for international comparisons. Future research could, on the one hand, broaden the scope of “detecting shifts of spatial patterns in population trends” in both time and space, for example, by including cross-border metropolitan regions or analyzing long-term processes (e.g., structural changes in the economy) or effects of historical events on population development and settlement structure. On the other hand, local case studies are needed to better understand the interplay of demographic and economic factors, societal forces, and the institutional framework at the local, regional, national and even supranational levels (Hoekveld, 2015).
We see this paper as an invitation for further content-related and methodological discussion of the patterns and trends of population development at the local level in Germany and other countries. Against this backdrop, two questions especially warrant further attention: (1) what is the “proper” level of analysis, and (2) how should the results be interpreted? Turning to the first question, the fact that the very small municipalities are overrepresented in the categories “islands of growth” and “islands of shrinkage” shows that it would be premature to conclude that the smaller the unit of analysis, the more realistic and informative are the results. Figuratively speaking, if the units of analysis are too small, there is a risk of not seeing the wood for the trees, while it becomes difficult to see that the wood is made up of individual trees if the units become too big. Our analysis has shown that an intermediary level between municipalities and smaller regions (NUTS3) could be a good compromise in countries with a high percentage of small municipalities. However, choosing the proper level of analysis should always be connected to the research question. To pick up the metaphor again: not seeing the wood is less of a problem if research focuses on the individual trees and vice versa. In this sense and also related to the MAUP, the challenge to find the best possible unit of analysis remains one of the key questions of population geography, especially against the backdrop that in Germany (and many other countries), the municipality is the lowest level for which statistical data are available. Although the method applied in this paper is somehow robust against big outliers, the use of grid data might be an interesting solution to solve the problems of drawing municipal borders and contrasting sizes of municipalities in different (federal) states. However, while using grid cells instead of municipalities as containers of populations would solve some of the problems of quantitative population geography, it would, however, create some new challenges and problems (not relating the results to administrative units) and leave some old ones unsolved (e.g., the MAUP).
The second question is related to the interpretation of the results, notably the challenge of how to explain the patterns and trends we have described above. The challenge is that the population development of a municipality is the result of a complex interplay of demographic factors, such as birth and death rates and rates of in- and out-migration. All of these factors are determined and influenced by a bundle of (different) societal, economic and locational, inter alia, factors operating at different levels – from the individual to the global. Analyzing the drivers and trying to explain the patterns and trends described above, therefore, requires a complex multilevel statistical model, which was beyond the scope of this paper.
Our analysis focused on the spatial aspects of the patterns and trends of population development at the level of municipalities over time. Further analytical steps could focus more on temporal aspects, for example, by using sequence analysis and the clustering of the trajectories (e.g., annual population change; belonging to a hot spot, cold spot or island) to allow for a more detailed analysis of the spatial patterns of population development in Germany. A second future avenue of research would be to look into the interdependencies of (transport) infrastructures and population development, both from a spatial perspective and over time, including commuting as an adaptation strategy.
One of the biggest challenges for quantitative population geography, however, is represented by the concept of population itself and the way in which population is being defined, registered and measured statistically. Do population registers in which each citizen has (only) one permanent residence where they are statistically counted still reflect today's realities of life, mobility and multi-locality? The challenge of how to deal with secondary residents and multi-locality is, in a nutshell, are people registered as primary residents really “present” and people who are not really “absent”? Using household statistics might be a good and robust alternative, but these data are hardly available on high spatial (e.g., municipalities) or temporal (e.g., yearly) resolutions. Another challenge, not just for Germany, is the data situation for different types of international migration. Widespread inconsistencies in the recording of immigration and emigration from abroad and imprecision in the statistical recording of asylum seekers without long-term residence status or during the recognition procedure complicate the analysis of the effects of international migration on population levels and population trends at the municipal level.
In fact, applying the analysis presented here for other indicators and/or other spatial units would allow the testing of the sensitivity of patterns and islands against other processes and multiple scales. Consequently, regarding the questions, challenges and problems we have touched upon in this paper and the ways we have demonstrated how to deal with them, we call for both a rethinking of quantitative population geography allowing for a richer set of indicators and scales and a debate on new perspectives of a conceptual–methodological coalition of new geospatial tools.
The software used to spatially process and visualize the data is ArcMap 10.5 by ESRI and can be found here: https://support.esri.com/en/products/desktop/arcgis-desktop/arcmap/10-8-2 (ESRI, 2022). In particular, the hot- and cold-spot analysis using local G* statistics, as well as the cluster and outlier analysis using Anselin's local Moran's I statistic, can be reproduced by following the steps in this documentation: https://desktop.arcgis.com/en/arcmap/latest/tools/spatial-statistics-toolbox/hot-spot-analysis.htm (ArcGIS, 2022) and https://desktop.arcgis.com/en/arcmap/latest/tools/spatial-statistics-toolbox/cluster-and-outlier-analysis-anselin-local-moran-s.htm (ArcGIS, 2022).
The dataset with the population numbers of all German municipalities between 1990 and 2019 is available in the Supplement to this article.
The supplement related to this article is available online at: https://doi.org/10.5194/gh-77-369-2022-supplement.
The analyzed data was compiled and processed by TL and MW. MW was responsible for the hot- and cold-spot analyses and created the maps. All authors jointly developed the concept of the paper and interpreted the results of the analyses. TL and MW wrote the manuscript with support from AH. All authors were involved in revising the manuscript based on the reviewers’ comments and suggestions.
The contact author has declared that none of the authors has any competing interests.
Publisher's note: Copernicus Publications remains neutral with regard to jurisdictional claims in published maps and institutional affiliations.
The authors would like to thank the two anonymous reviewers for their highly constructive and helpful comments.
This paper was edited by Nadine Marquardt and reviewed by two anonymous referees.
ArcGIS: Hot Spot Analysis (Getis-Ord Gi*), ArcGIS [code], https://desktop.arcgis.com/en/arcmap/latest/tools/spatial-statistics-toolbox/hot-spot-analysis.htm, last access: 31 May 2022.
ArcGIS: Cluster and Outlier Analysis (Anselin Local Moran's I), ArcGIS [code], https://desktop.arcgis.com/en/arcmap/latest/tools/spatial-statistics-toolbox/cluster-and-outlier-analysis-anselin-local-moran-s.htm, last access: 31 May 2022.
BKG: Municiplaity boundaries, Shape files, https://gdz.bkg.bund.de/index.php/default/digitale-geodaten/verwaltungsgebiete.html?___store=default (last access: 28 June 2021), 2020.
Born, K. M.: Ländliche Räume in Deutschland: Differenzierungen, Entwicklungspfade und -brüche, Geogr. Rundsch., 63, 4–10, 2011.
Brunet, R.: Lignes de force de l'espace Européen, Mappemonde, 66, 14–19, 2002.
Chew, B., Satpathy, A., and Wong, E.: Geospatial analyses to determine academic success factors in California's K-12 education, Ann. GIS, 26, 81–100, https://doi.org/10.1080/19475683.2020.1739141, 2020.
Danielzyk, R.: Strategien von Wachstumsregionen in peripheren Räumen – Das Beispiel Emsland, in: Wachstumsregionen fernab der Metropolen: Chancen, Potenziale und Strategien, edited by: Köhler, S., Verlag der ARL, Hannover, 51–60, ISBN 978-3-88838-334-2, 2007.
Destatis – Statistisches Bundesamt: Gemeinden in Deutschland nach Fläche und Bevölkerung am 31.12.1990 (Jahr) zum Gebietsstand 01.01.1991, Wiesbaden, https://www.destatis.de/DE/Themen/Laender-Regionen/Regionales/Gemeindeverzeichnis/Administrativ/Archiv/GVAuszugJ/31121990_Auszug_GV.html (last access: 11 September 2022), 1992.
Domhardt, H. J.: Eigenentwicklung, in: Handwörterbuch der Stadt- und Raumentwicklung, Akademie für Raumforschung und Landesplanung, Hannover, 457–462, http://nbn-resolving.de/urn:nbn:de:0156-5599410 (last access: 11 September 2022), 2018.
Duque, J. C., Laniado, H., and Polo, A.: S-maup: Statistical test to measure the sensitivity to the modifiable areal unit problem, PloS One, 13, e0207377, https://doi.org/10.1371/journal.pone.0207377, 2018.
ESPON – European Spatial Planning Obervation Network: The Modifiable Area Unit Problem, Final Report of ESPON Project 3.4.3, Esch-sur-Alzette, https://www.espon.eu/sites/default/files/attachments/espon343_maup_final_version2_nov_2006.pdf (last access: 17 June 2021), 2006.
ESPON and University of Luxembourg: METROBORDER Cross-border Polycentric Metropolitan Regions Final Report, Esch-sur-Alzette, ESPON, ISBN 978-99959-684-8-9, 2010.
ESRI: Hot-Spot-Analyse (Getis-Ord Gi*), https://desktop.arcgis.com/de/arcmap/10.3/tools/spatial-statistics-toolbox/hot-spot-analysis.htm (last access: 17 April 2021), 2020.
ESRI: ArcMap 10.5, ESRI [code], https://support.esri.com/en/products/desktop/arcgis-desktop/arcmap/10-8-2, last access: 31 May 2022.
Fink, P., Hennicke, M., and Tiemann, H.: Unequal Germany, Socioeconomic Disparities Report 2019, Friedrich-Ebert-Stiftung, Bonn, https://library.fes.de/pdf-files/fes/15766.pdf (last access 11 September 2022), 2019.
Frank, S.: Innere Suburbanisierung? Mittelschichteltern in den neuen innerstädtischen Familienenklaven, in: Polarisierte Städte, Soziale Ungleichheit als Herausforderung für die Stadtpolitik, edited by: Kronauer, M. and Siebel, W., Campus, Frankfurt a. M., New York, 69–89, 2013.
Gans, P.: Reurbanisierungstypen in Deutschland: Wissensökonomie und Komponenten der Bevölkerungsentwicklung (2004–2010), in: Reurbanisierung in baden-württembergischen Stadtregionen, edited by: Fricke, A., Siedentop, S., and Zakrzewski, P., Akademie für Raumforschung und Landesplanung, Hannover, 11–31, https://nbn-resolving.de/urn:nbn:de:0156-39770212015 (last access: 11 September 2022), 2015.
Glander, M. L. and Hoßmann, I.: Land mit Aussicht, Was sich von dem wirtschaftlichen und demografischen Erfolg des Oldenburger Münsterlandes lernen lässt, Berlin-Institut für Bevölkerung und Entwicklung, Berlin, https://nbn-resolving.org/urn:nbn:de:0168-ssoar-3237 (last access: 11 September 2022), 2009.
Guérois, M., Bretagnolle, A., Pavard, A., Gourdon, P., and Zdanowska, N.: Following the population of European urban areas in the last half century (1961–2011): the TRADEVE database, Cybergeo, 891, 1–26, https://doi.org/10.4000/cybergeo.32034, 2019.
Haase, A., Kabisch, S., Steinführer, A., Bouzarovski, S., Hall, R., and Ogden, P.: Emergent spaces of reurbanisation: exploring the demographic dimension of inner-city residential change in a European setting, Popul. Space Place, 16, 443–463, https://doi.org/10.1002/psp.603, 2010.
Heider, B.: The impact of EU Eastern enlargement on urban growth and decline: New insights from Germany's Eastern border, Pap. Reg. Sci., 98, 1443–1468, https://doi.org/10.1111/pirs.12407, 2019.
Heider, B., Stroms, P., Koch, J., and Siedentop, S.: Where do immigrants move in Germany? The role of international migration in regional disparities in population development, Popul. Space Place, 26, 1443–1468, https://doi.org/10.1002/psp.2363, 2020.
Henger, R. and Oberst, C.: Alterung der Gesellschaft im Stadt-Land Vergleich, IW-Kurzbericht 16/2019, http://hdl.handle.net/10419/195079 (last access: 11 September 2022), 2019.
Herfert, G. and Osterhage, F.: Bevölkerungsentwicklung – Schrumpfung auch im Westen angekommen, Nationalatlas aktuell 5, http://aktuell.nationalatlas.de/bevoelkerungsentwicklung-1_01-2011-0-html/ (last access: 11 September 2022), 2011.
Hoekveld, J.: Spatial differentiation of population development in a declining region: the case of Saarland, Geogr. Ann. Ser. B, 97, 47–68, https://doi.org/10.1111/geob.12065, 2015.
Huby, M., Cinderby, S., White, P., and de Bruin, A.: Measuring inequality in rural England: the effects of changing spatial resolution, Environ. Plan. A, 41, 3023–3037, https://doi.org/10.1068/a425, 2009.
Kim, S. M. and Choi, Y.: Assessing Statistically Significant Heavy-Metal Concentrations in Abandoned Mine Areas via Hot Spot Analysis of Portable XRF Data, Int. J. Environ. Res. Publ. Health, 14, 654, https://doi.org/10.3390/ijerph14060654, 2017.
Klüsener, S. and Zagheni, E.: The East-West Gradient in Spatial Population Development Within Germany: Temporary GDR Legacy Versus Longstanding Spatial Disparities, Hist. Method., 47, 167–179, https://doi.org/10.1080/01615440.2014.955234, 2014.
Krajewski C.: Peuplierung einer klassischen Peripherie? Wohnmigrations- und Integrationsprozesse von Polen im deutschen Grenzgebiet der Euroregion POMERANIA, in: Grenzen. RaumFragen: Stadt – Region – Landschaft, edited by: Heintel, M., Musil, R., and Weixlbaumer, N., Springer VS, Wiesbaden, https://doi.org/10.1007/978-3-658-18433-9_14, 2018.
Leibert, T.: She leaves, he stays? Sex-selective migration in rural East Germany, J. Rural Stud., 43, 267–279, https://doi.org/10.1016/j.jrurstud.2015.06.004, 2016.
Leibert, T.: Demographischer Wandel ade? Aktuelle Einwohnerentwicklung in Deutschland, Nationalatlas aktuell, 13, http://aktuell.nationalatlas.de/einwohnerentwicklung-1_01-2019-0-html/ (last access: 11 September 2022), 2019.
Leibert, T.: Demographische Strukturen und Entwicklungen in Kleinstädten, in: Kompendium Kleinstadtforschung, edited by: Steinführer, A., Porsche, L., and Sondermann, M., ARL – Akademie für Raumentwicklung in der Leibniz-Gemeinschaft, Hannover, 189–208, ISBN 978-3-88838-103-4, 2021.
Madelin, M., Grasland, C., Mathian, H., Sanders, L., and Vincent, J.-M.: Das “MAUP”: Modifiable Areal Unit – Problem oder Fortschritt?, Inf. Raumentwickl. 10./11.2009, https://www.bbsr.bund.de/BBSR/DE/veroeffentlichungen/izr/2009/10_11/Inhalt/DL_Madelin_ua.pdf?__blob=publicationFile&v=2 (last access: 17 February 2021), 645–660, 2009.
Nuissl, H. and Rink, D. The `production' of urban sprawl. Urban sprawl in Eastern Germany as a phenomenon of post-socialist transformation, Cities, 222, 123-134, https://doi.org/10.1016/j.cities.2005.01.002, 2005.
Ord, J. K. and Getis, A.: Local Spatial Autocorrelation Statistics: Distributional Issues and an Application, Geogr. Anal., 27, 286–306, https://doi.org/10.1111/j.1538-4632.1995.tb00912.x, 1995.
Osterhage, F.: The End of Reurbanisation? Phases of Concentration and Deconcentration in Migratory Movements in North Rhine-Westphalia, Comp. Popul. Stud., 43, 131–156, 2018.
Popp, H.: Gebietsreformen machen das Land zur Stadt, Nationalatlas aktuell, 12, http://aktuell.nationalatlas.de/stadtflaechen-6_12-2018-0-html/ (last access: 11 September 2022), 2018.
Reichert-Schick, A.: Rural gentrification an der Obermosel? Eine Fallstudie zu internationaler Wohnmigration und den Herausforderungen für die Dorfentwicklung, Europa Regional, 24, 77–94, https://www.ssoar.info/ssoar/handle/document/57382 (last access: 11 September 2022), 2017.
Rösel, F.: Die Wucht der deutschen Teilung wird völlig unterschätzt, ifo Dresden berichtet, ifo Institut, 26, 23–25, ISSN 0945-5922, 2019.
Sanchez-Cuervo, A. M. and Aide, T. M.: Identifying hotspots of deforestation and reforestation in Colombia (2001–2010): implications for protected areas, Ecosphere, 4, 143, https://doi.org/10.1890/ES13-00207.1, 2013.
Sánchez-Martín, J. M., Rengifo-Gallego, J. I., and Blas-Morato, R.: Hot Spot Analysis versus Cluster and Outlier Analysis: An Enquiry into the Grouping of Rural Accommodation in Extremadura (Spain), ISPRS Int. J. Geo-Inf., 8, 176, https://doi.org/10.3390/ijgi8040176, 2019.
Siedentop, S.: Reurbanisierung, in: Handbuch Stadtkonzepte, edited by: Rink, D. and Haase, A., Verlag Barbara Budrich, Opladen, 381–403, https://doi.org/10.36198/9783838549552, 2018.
Slupina, M., Damm, T., and Klingholz, R.: Im Osten auf Wanderschaft. Wie Umzüge die demografische Landkarte zwischen Rügen und Erzgebirge verändern, Berlin-Institut für Bevölkerung und Entwicklung, Berlin, ISBN 978-3-9816212-9-7, 2016.
Sohn, C. and Stambolic, N.: The urban development of European border regions: a spatial typology, Europa Regional, 21.2013, 177–189, https://nbn-resolving.org/urn:nbn:de:0168-ssoar-457453 (last access: 11 September 2022), 2015.
StÄBL – Statistische Ämter des Bundes und der Länder: Daten aus dem Gemeindeverzeichnis: Verwaltungsgliederung in Deutschland am 31.03.2022, Gebietsstand: 31.03.2022 (1. Quartal), Wiesbaden, https://www.destatis.de/DE/Themen/Laender-Regionen/Regionales/Gemeindeverzeichnis/Administrativ/Archiv/Verwaltungsgliederung/Verwalt1QAktuell.html (last access: 11 September 2022), 2022.
Stawarz, N., Sander, N., Sulak, H., and Rosenbaum-Feldbrügge, M.: The turnaround in internal migration between East and West Germany over the period 1991 to 2018, Demogr. Res., 43, 993–1008, https://doi.org/10.4054/DemRes.2020.43.33, 2020.
Steinführer, A. and Kohring, J.: Reurbanisierung durch selektive Wanderungen Älterer? Entwicklungen in kleineren niedersächsischen Mittelzentren und ihre siedlungsstrukturellen Folgen, in: Reurbanisierung zwischen Wunsch und Wirklichkeit. Ein Blick auf nordwestdeutsche Städte und Regionen, edited by: Scholich, D., Akademie für Raumforschung und Landesplanung, Hannover, https://nbn-resolving.org/urn:nbn:de:0168-ssoar-65542-2, last access 11 September 2022, 2019.
Südekum, J., Dauth, W., and Findeisen, S: Verlierer(-regionen) der Globalisierung in Deutschland: Wer? Warum? Was tun?, DICE Ordnungspolitische Perspektiven 89, Heinrich Heine University Düsseldorf, Düsseldorf Institute for Competition Economics (DICE), Düsseldorf, ISBN 978-3-86304-689-7, 2016.
Tanis, K.: Regional distribution and location choices of immigrants in Germany, Reg. Stud., 54, 483–494, https://doi.org/10.1080/00343404.2018.1490015, 2020.
Weber, G. and Fischer, T.: Gehen oder Bleiben? Die Motive des Wanderungs- und Bleibeverhaltens junger Frauen im ländlichen Raum der Steiermark und die daraus resultierenden Handlungsoptionen im Rahmen der Lokalen Agenda 21 Prozesse, Institut für Raumplanung und Ländliche Neuordnung der Universität für Bodenkultur Wien, Wien, https://ams-forschungsnetzwerk.at/downloadpub/BOKU_endbericht_gehen_bleiben_03_10.pdf (last access: 11 September 2022), 2012.
Weber, H.: Could Immigration Prevent Population Decline? The Demographic Prospects of Germany Revisited, Comp. Popul. Stud., 40, 165–190, https://doi.org/10.12765/CPoS-2015-05en, 2015.
Wolff, M. and Wiechmann, T.: Urban growth and decline: Europe's shrinking cities in a comparative perspective 1990–2010, Eur. Urban Reg. Stud., 25, 122–139, https://doi.org/10.1177/0969776417694680, 2018.
Wolff, M., Haase, A., and Leibert, T.: Mehr als Schrumpfung und Wachstum? Trends der demographischen Raumentwicklung in Deutschland nach 2011, Helmholtz-Zentrum für Umweltforschung - UFZ, Leipzig, https://nbn-resolving.org/urn:nbn:de:0168-ssoar-66431-2 (last access: 11 September 2022), 2020.
Wolff, M., Leibert, T., Haase, A., and Rink, D.: Aktuelle Bevölkerungsentwicklung unter dem Einfluss der COVID-19 Pandemie In: Nationalatlas aktuell 15 (07.2021) 4 [23.07.2021], Leibniz-Institut für Länderkunde (IfL), Leipzig, http://aktuell.nationalatlas.de/bevoelkerungsentwicklung-4_07_2021-0-html/ (last access: 30 May 2022), 2021.
Wolff, M., Haase, A., Leibert, T., and Cunningham Sabot, E.: Calm ocean or stormy sea? Tracing 30 years of demographic spatial development in Germany, Cybergeo., 1003, https://doi.org/10.4000/cybergeo.38031, 2022.
The authors will be happy to provide the maps on request.